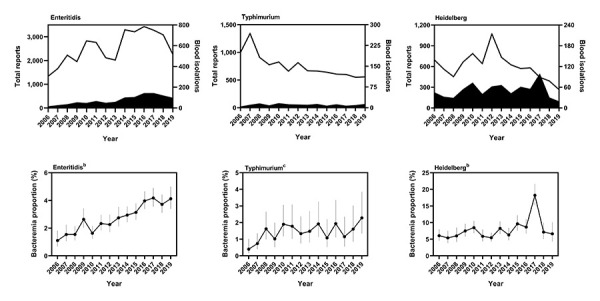
Figure 7.

Bacteremia rates of individual nontyphoidal Salmonella serovars, 2006–2019a,b,c
a Top row shows total (line) and blood (solid shape) isolations reported to the National Enteric Surveillance Program (NESP). Bottom row shows the bacteremia proportions. Vertical lines indicate 95% confidence intervals
b P<0.0001
c P=0.0031
