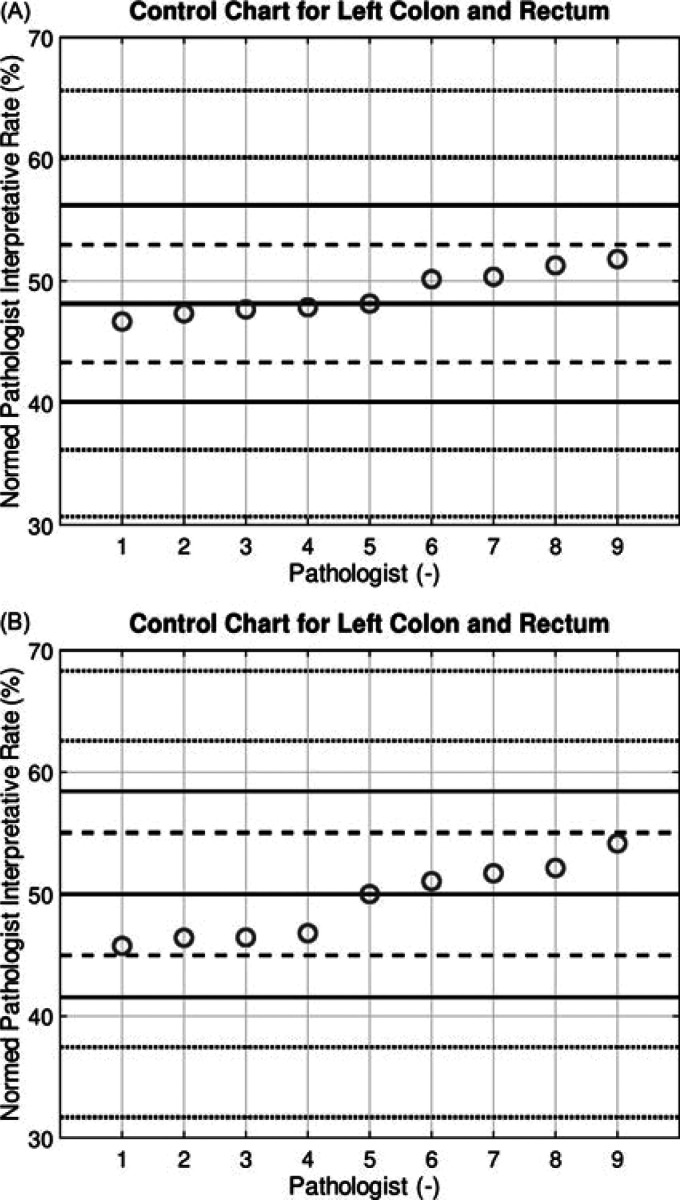
Figure 4.
Control chart showing (A) the normalized left colon diagnostic rate by pathologist in the first year of the study, and (B) the normalized left colon diagnostic rate by pathologist in the second year of the study. The horizontal line in the center of the control chart is the group median diagnostic rate. The dashed (inner control) lines represent the boundaries of the 95% CI and correspond to P < .05. The solid (outer control) lines represent the boundaries of the 99.9% CI and correspond to P < .001. CI indicates confidence interval.

