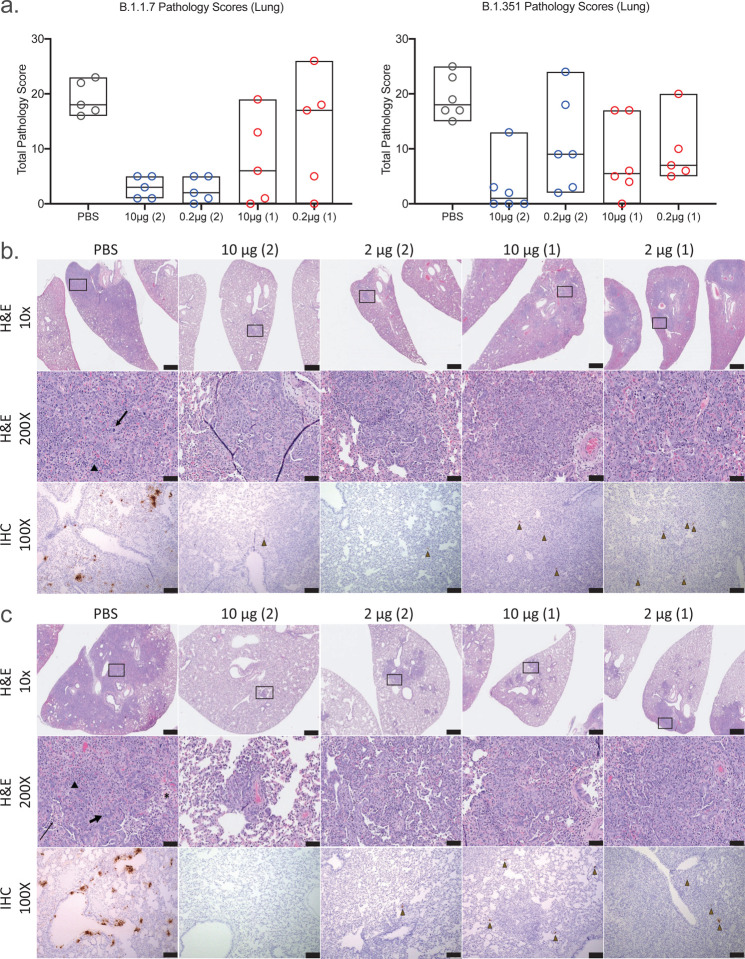
Figure 4. Standard and immunohistopathologic examination post-challenge.
Lung tissues were collected at necropsy on day 6 post-challenge, fixed with neutral buffered formalin, and stained with hematoxylin and eosin (H&E) for standard microscopic examination as well has submitted for immunohistochemical (IHC) staining for SARS-CoV-2 nucleocapsid (N) protein. a, H&E stained slides were scored for pathologic effects on the y-axis (see Methods) for B.1.1.7 (left) and B.1.351 (right) challenged hamsters. Vaccination groups were plotted in box plots where the horizontal bar is the median group score. Vaccination groups are given as: PBS (phosphate buffered saline) control (gray circles); 10 μg and 0.2 μg 2-dose vaccine regimens (blue circles); 10 μg and 0.2 μg 1-dose vaccine regimens (red circles). b,c, Representative lung tissue sections from the PBS control and 10 μg and 0.2 μg 2-dose and 1-dose regimens with the number of vaccinations given parenthetically for B.1.1.7 (b) and B.1.351 (c) challenged hamsters in the columns as indicated. Rows are given by either H&E at 10- and 200-times magnification power (10X and 200X, respectively) or IHC of SARS-CoV-2 viral antigen at 100 times magnification power (100X). The black boxes in the top row indicate the area magnified in the middle row. Interstitial pneumonia is characterized by inflammatory cellular infiltrates (triangle), type II pneumocyte hyperplasia (thick arrow), bronchiolar epithelial hyperplasia, bronchiolar exudate (thin arrow) and edema (asterisk). SARS-CoV-2 immunopositive cells are highlighted by brown triangles. Scale bars: Top row, 1 mm; middle row, 50 μm; bottom row, 100 μm.

