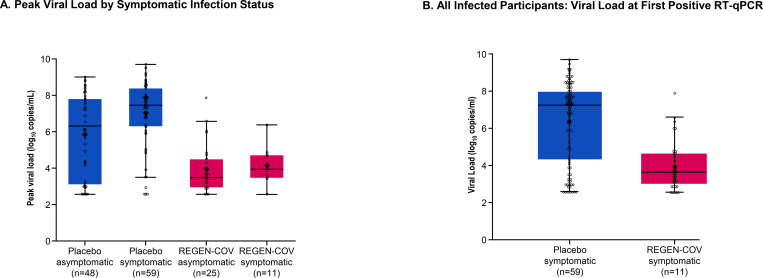
Figure 2. Individuals Who Become Infected Despite REGEN-COV Treatment Demonstrate Lower Viral Burden Compared With Placebo-Treated Individuals.
Panel A shows peak viral load by symptomatic infection status. Panel B shows all infected participants: viral load at first positive RT-qPCR. Panel C shows infected participants by symptoms: viral load at first positive RT-qPCR. Lines in the boxes represent the median. Large, bolded dots in the boxes represent the mean. Bottom and top of boxes represent quartiles 1 (25th percentile) and 3 (75th percentile), respectively. Whiskers represent the 1.5 times interquartile range.
RT-qPCR denotes quantitative real-time polymerase chain reaction, and SC subcutaneous.


