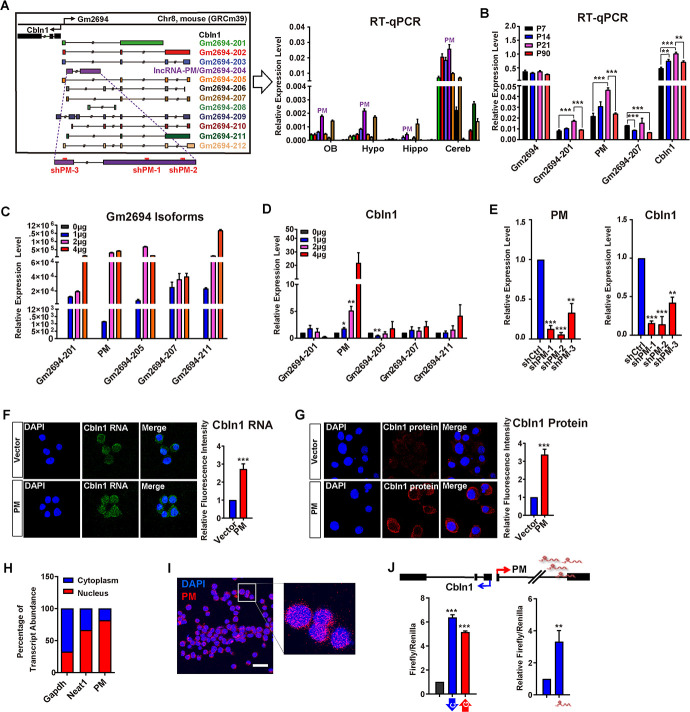
Fig 1. Identification of lncRNA-PM, a splicing isoform of Gm2694, which is required for Cbln1 activation.
(A) Left: illustration of 12 Gm2694 isoforms indicated as different colors. The shPM-1, shPM-2, and shPM-3 used in the study were indicated. Right: the relative expression levels of the 12 isoforms of Gm2694 in the indicated brain regions. Data are shown as means ± SEMs, n = 3. Gm2694-204 is designated as lncRNA-PM (PM). (B) The relative expression levels of Gm2694 (for 201, 202, 203, 205, 206, 207, 209, and 210), Gm2694-201, PM, Gm2694-205, Gm2694-207, and Cbln1 at the indicated cerebellar developmental time points were measured by RT-qPCR. Data are shown as means ± SEMs, n = 3. (C, D) The expression levels of the indicated Gm2694 isoforms (C) and Cbln1 (D) under the indicated treatments. (E) The expression levels of Cbln1 in control or PM shRNAs (shPM-1/2/3)-treated Neuro2a cells, detected by RT-qPCR. Data are shown as means ± SEMs, n = 3. (F) Left: representative images of Cbln1 mRNA in the control or PM-overexpressed Neuro2a cells, detected by FISH. Right: quantification of the left. Data are shown as means ± SEMs, n = 3. (G) Left: representative immunofluorescence images of Cbln1 protein in the control (Vector) or PM-overexpressed (PM) Neuro2a cells. Right: quantification of the left. Data are shown as means ± SEMs, n = 3. (H) Subcellular distributions of PM, Gapdh, and Neat1 by fractionating assay in Neuro2a cells. Gapdh and Neat1 RNA served as positive controls for RNAs predominantly expressed in cytoplasm and nucleus, respectively. Data are shown as means ± SEMs, n = 3. (I) Representative FISH image of PM RNA (red) in Neuro2a cells. Nuclei were stained with DAPI (blue). (J) Top: schematic illustration of the Cbln1/PM locus. Bottom left: luciferase assays indicate the activity changes of pGL3-Cbln1 (blue) and pGL3-Gm2694 (red), compared with pGL3 vector control (black). Bottom right: Luciferase assays indicate the activity changes of pGL3-Cbln1 in the presence of control or PM-expressing plasmid. Data are shown as means ± SEMs, n = 3. Scale bar, 13 um. All RT-qPCR results were normalized to Gapdh. All the data of this figure can be found in the S1 Data file. *P < 0.05, **P < 0.01, and ***P < 0.001. Cbln1, Cerebellin-1; Cereb, Cerebellum; FISH, fluorescence in situ hybridization; Hippo, hippocampus; Hypo, hypothalamus; lncRNA-PM, lncRNA-Promoting Methylation; OB, olfactory bulb; RT-qPCR, reverse transcription-quantitative PCR.

