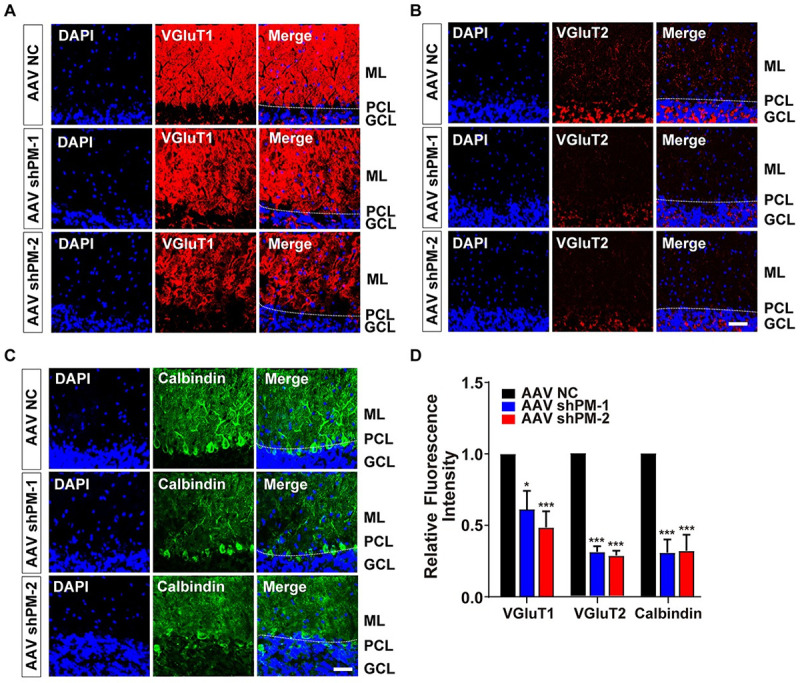
Fig 3. Reduced density of VGluT1, VGluT2, and Calbindin in the shPMs-injected mice.

(A–C) Representative immunofluorescence images showed the density of VGluT1 (A), VGluT2 (B), or Calbindin (C) in the control and indicated shPMs-injected mice. VGluT1, VGluT2, and Calbindin are markers for PF terminals, climbing fiber terminals, and PCs, respectively. (D) Quantification of the indicated markers obtained from A–C. All the data of this figure can be found in the S1 Data file. Data are shown as means ± SEMs, n = 3. Scale bar, 40 um. *P < 0.05 and ***P < 0.001. GCL, granule cell layer; ML, molecular layer; PCL, Purkinje cell layer; PF, parallel fiber; VGluT1, vesicular glutamate transporter 1; VGluT2, vesicular glutamate transporter 2.
