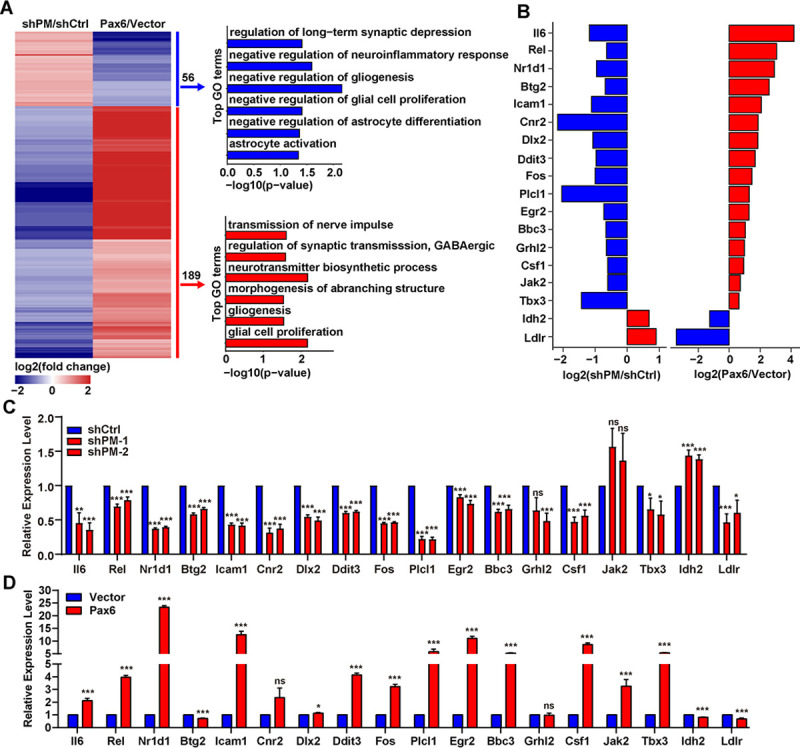
Fig 7. LncRNA-PM regulates neuronal associated genes.

(A) Left: heatmap of dysregulated genes (|Fold change|>1.5, FDR < 0.05) in PM knockdown and Pax6 overexpression RNA-seq. Right: GO biological processes of PM and Pax6 coregulated genes. Red: positively regulated genes shared by PM and Pax6. Blue: negatively regulated genes shared by PM and Pax6. (B) Modulations of lncRNA-PM and Pax6 impact neuronal associated genes. Expression changes for selected genes are shown as the log2 expression ratio. Red: positively regulated genes shared by PM and Pax6. Blue: negatively regulated genes shared by PM and Pax6. (C and D) qPCR detection of the indicated genes upon PM knockdown (C) and Pax6 overexpression (D). All the data of this figure can be found in the S1 Data file. Data are shown as means ± SEMs, n = 3. *P < 0.05, **P < 0.01, and ***P < 0.001. FDR, false discovery rate; GO, Gene Ontology; lncRNA-PM, lncRNA-Promoting Methylation; ns, no significance; qPCR, quantitative PCR; RNA-seq, RNA sequencing.
