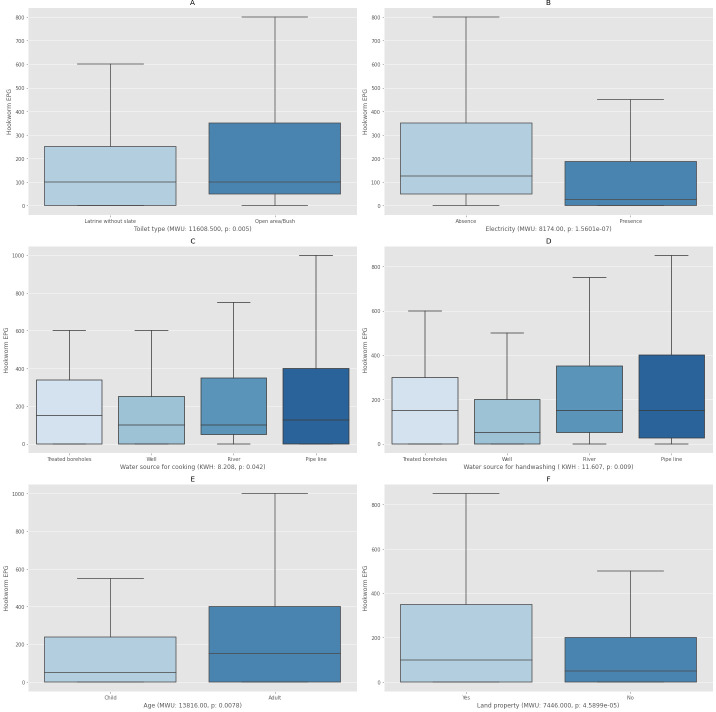
Fig 5. Boxplots showing the association between the individual number of eggs per gram of feces (EPG) and characteristics of the households.
A. Toilet Type. B. Presence/absence of electricity. C. Water source for cooking. D. Water source for handwashing. E. Age (Child refers to all those under 14 and Adult refers to all those 15 or older). F. Land property. MWU: Mann-Whitney U, KWH: Kruskal-Wallis H, p: significance test (p<0.05).

