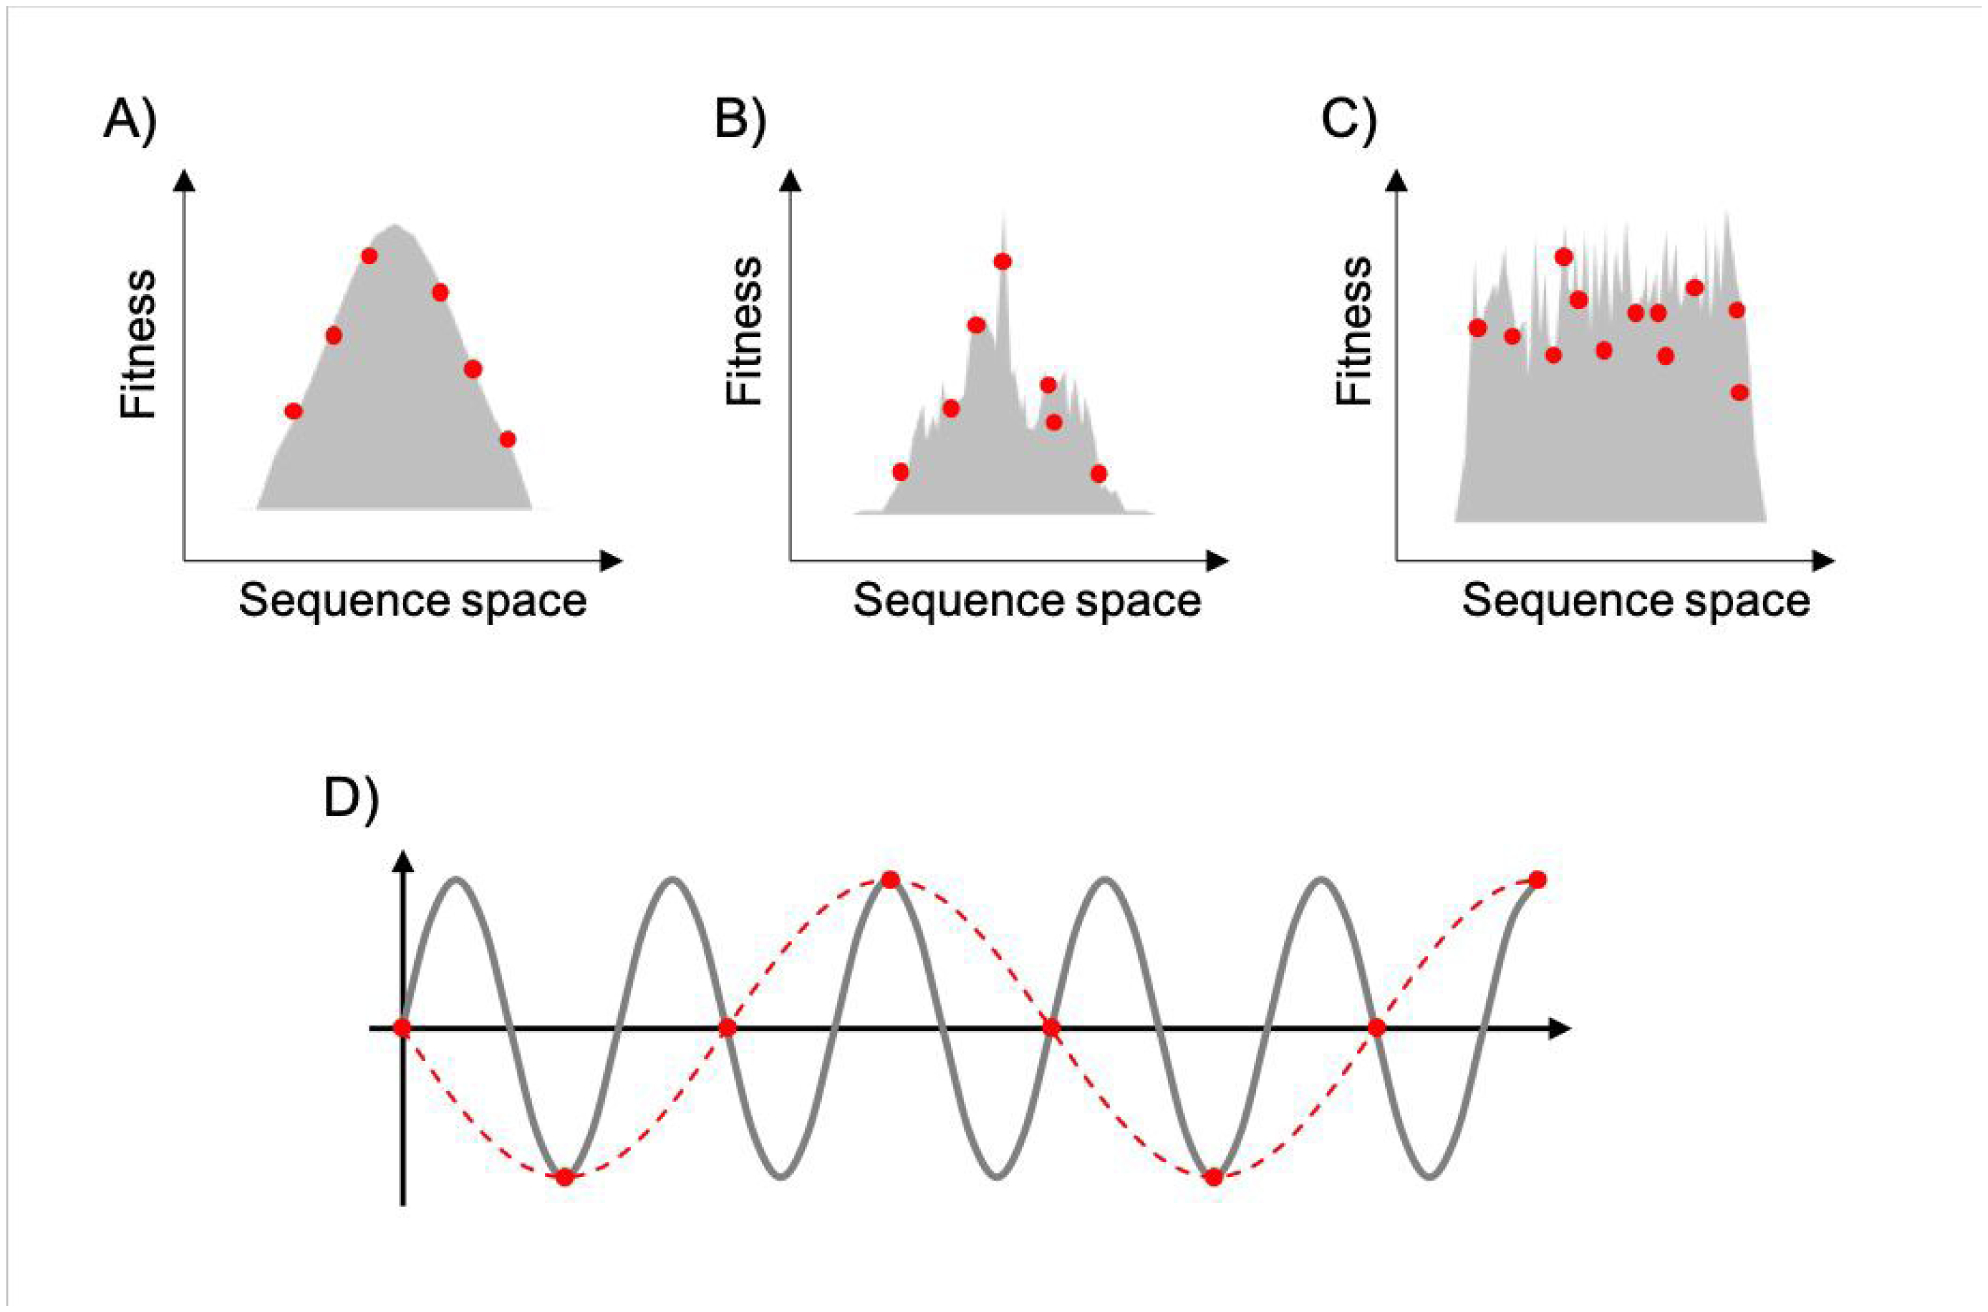
Figure 3. Representation of fitness landscapes with different levels of ruggedness.

Simplified 2D visualization of A) a smooth landscape (Mount Fuji type), B) an intermediate ruggedness landscape, and C) a highly rugged landscape. Red dots correspond to random sparse sampling on sequence space. In D), the gray line corresponds to a sine wave of frequency f, red dots correspond to sparse sampling below the critical sampling frequency (fS<2f), and red dashed line corresponds to the aliased wave reconstructed from undersampling.
