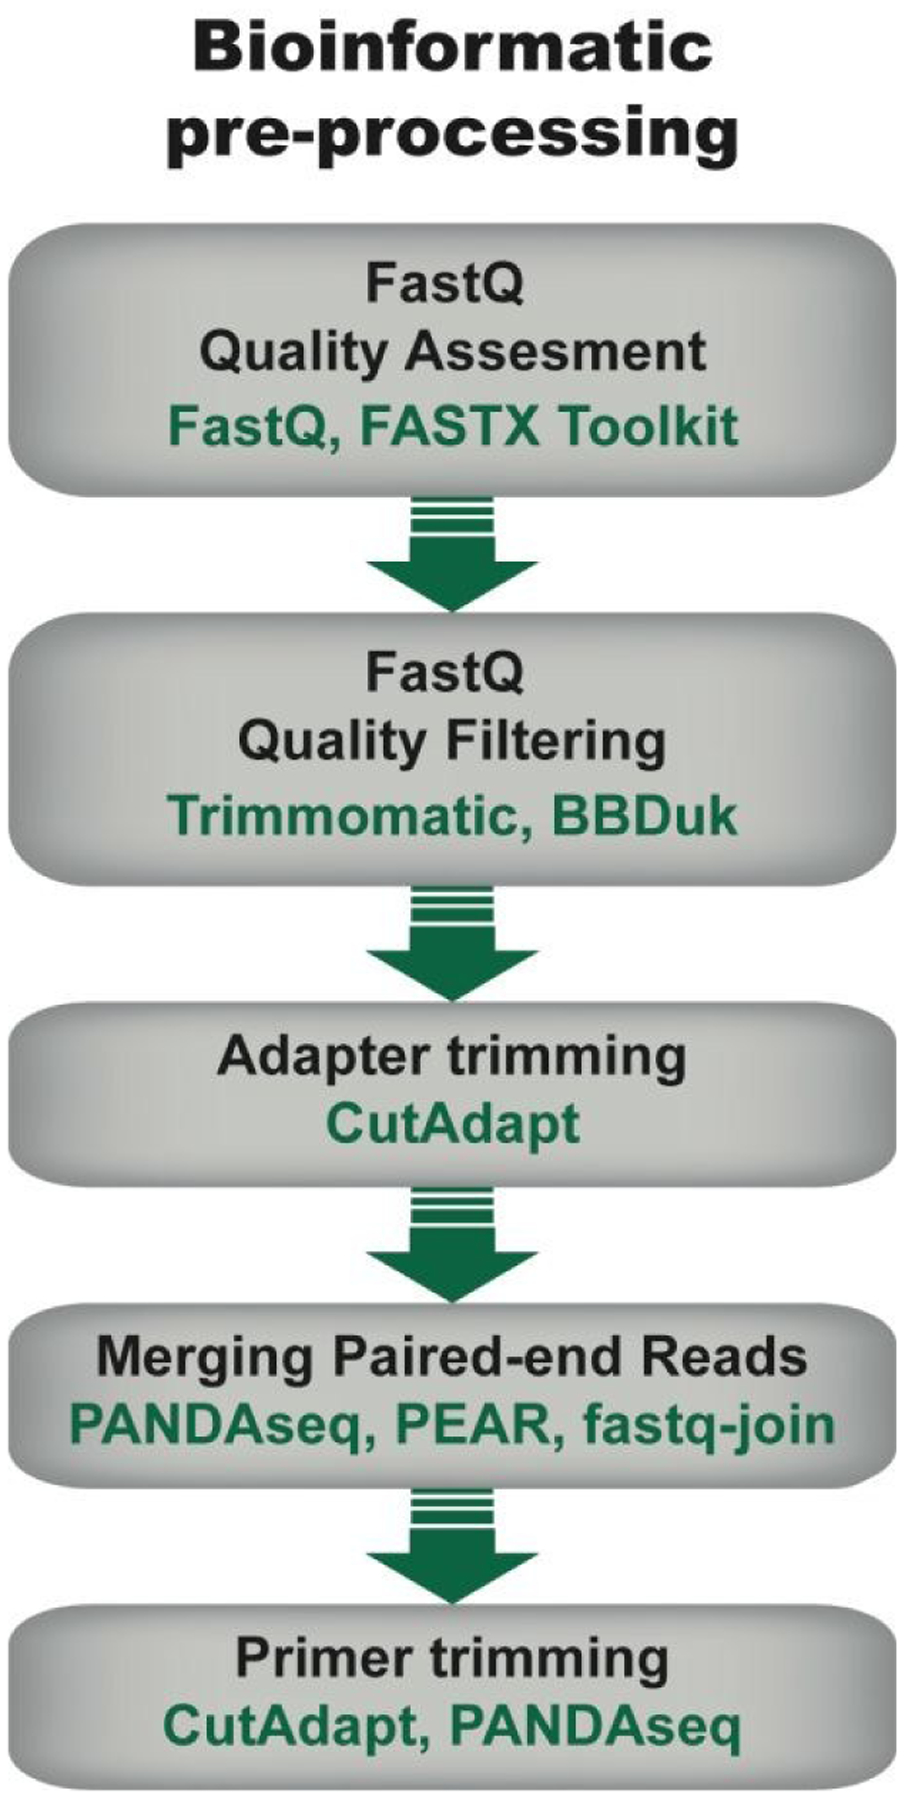
Figure 4. General flow chart for bioinformatic pre-processing of high throughput sequencing data for mRNA display.

Pre-processing steps include an initial quality assessment of the fastq sequences (i.e., sequencing data with associated quality metrics), quality filtering to discard sequences of low quality, adapter trimming in the case of amplicons shorter than the read length, joining of pair-end reads, and primer trimming. Some examples of tools that can be used at each step are given. Note that the use of each step depends on the data and desired downstream analysis.
