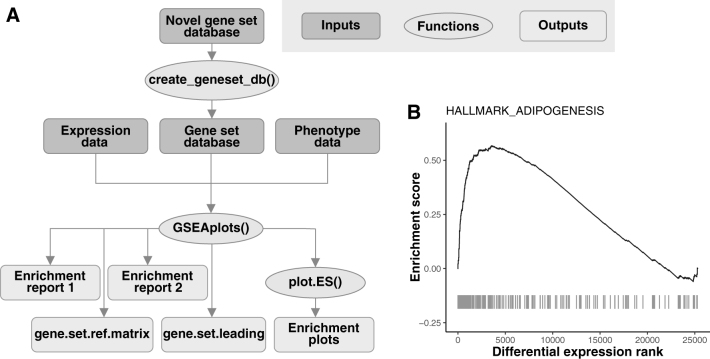
FIG. 1.
The GSEAplot R package includes novel functions for customizing gene set enrichment analysis. (A) The GSEAplot flowchart includes data inputs, essential functions, and outputs. (B) The customized enrichment plot shows the running enrichment score with respect to genes ranked by signal-to-noise ratio, where genes with elevated expression in females have lower differential expression ranks. The peak on the left indicates that genes related to adipogenesis have elevated expression in females relative to males (false discovery rate = 0). The tick marks denote adipogenesis-related genes. GSEA, Gene Set Enrichment Analysis.

