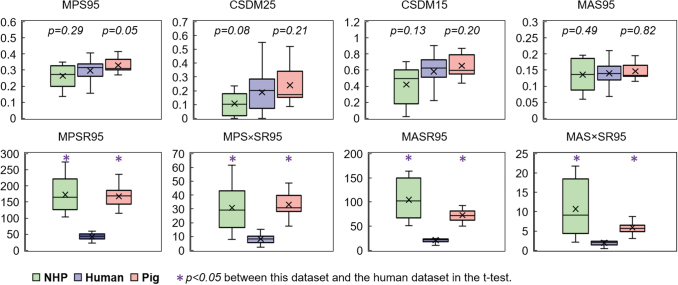
FIG. 5.
Distribution of metric values for mild traumatic brain injury cases in the human and animal dataset. For each box, the central band is the median, and the central “cross” marker is the mean, the box extends vertically between the 25th and 75th percentiles, the whiskers extend to the most extreme data that are not considered outliers. Color image is available online.

