Figure 1.
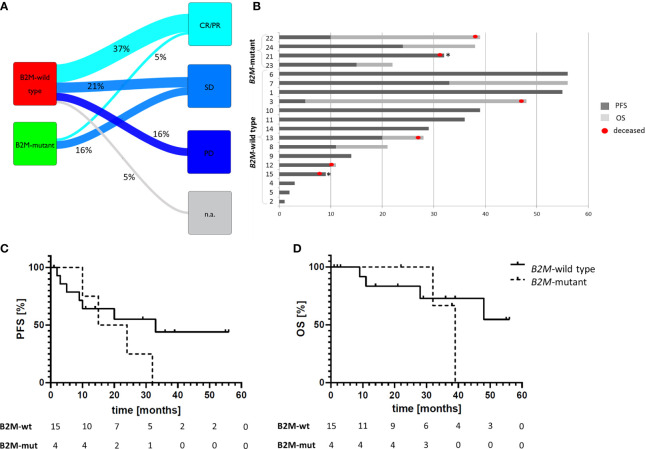
ICB therapy response depending on the tumor B2M mutation status. (A) Sankey diagram summarizing the therapy responses in 19 MSI GI cancer patients under ICB therapy. (B) Swimmer plot describing progression free survival (dark grey) and follow-up duration in 19 patients. Deceased patients are marked with a red dot, death unrelated to tumor disease is marked with an asterisk (*): one patient died because of concurrent cardiovascular disease, one patient died in septic shock, both patients did not show any signs of disease progression at this point. Patients #6-11, and 21 demonstrated PR, and patient #1 demonstrated CR as best response. Numbers refer to Patient IDs in Table 1 . (C, D) Survival curves of patients receiving ICB therapy depending on the B2M status of the tumor: progression-free (C) and overall survival (D). Despite nominal differences in PFS of B2M-mutant (n=4) and B2M-wild type (n=15) tumor patients (median PFS: 19.5 vs 33.0 months, respectively, p=0.74), the OS did not differ between these two patient groups (median OS 39 months vs. not reached, respectively, p>0.99), indicating good prognosis of patients with B2M-mutant tumors irrespectively of immune checkpoint blockade therapy. Statistical significance was analyzed using log-rank test.

