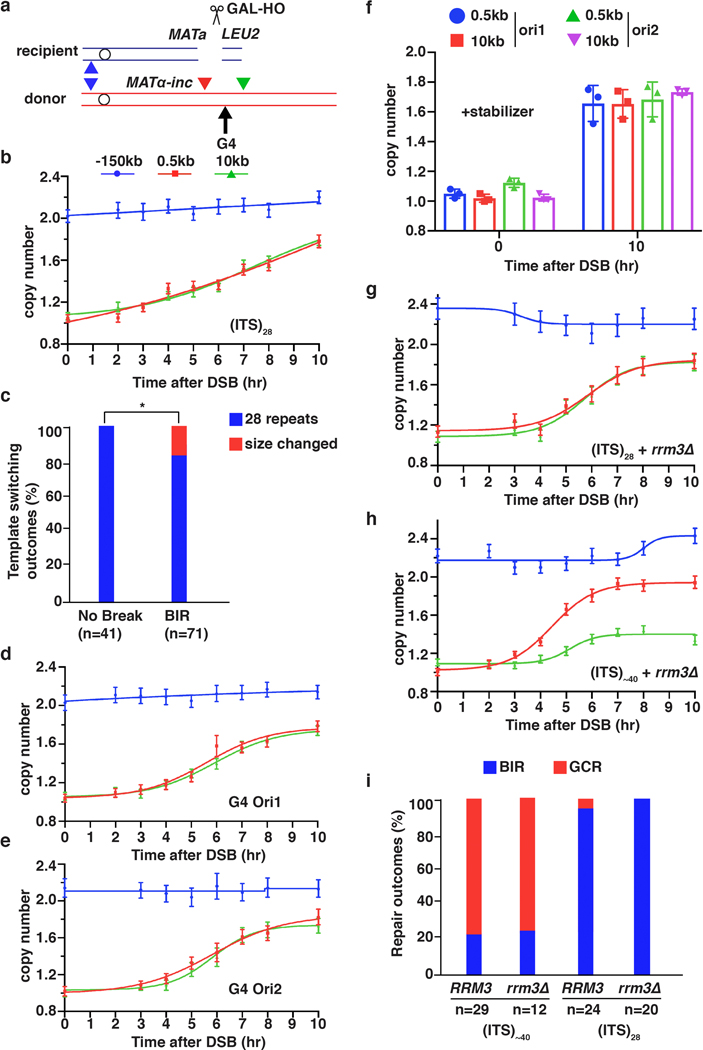
Extended Data Figure 6. G4 -forming sequence does not block BIR progression.
a, A G4-forming sequence or (TTAGGG)28 was inserted at the 6-kb position. The colors indicating positions are kept the same in panels b, d, e, g and h. b, AMBER analysis of BIR through (ITS)28 inserted at the 6 kb position. c, Sanger sequencing analysis of repair outcomes of BIR that traversed (ITS)28 show change in ITS copy number resulting from template switching. (Sample sizes (n) are indicated. * = statistically significant difference (p=0.0288) determined by Chi-square test (two-sided, df=1)). d, AMBER analysis of BIR through sequence that can form G4 structure during leading strand (Ori1) synthesis and e, during lagging strand (Ori2) synthesis. f, AMBER analysis of BIR through G4-forming sequences similar to d and e, but in the presence of G4-stabilizing drug, Phen-DC3. The means ± SD (n=3 independent biological repeats) indicated by error-bars. g, h, AMBER analysis of BIR synthesis in rrm3Δ mutant through (ITS)28 (g) and through (ITS)~40 (h). i, genetic analysis of GCR in (g) and (h) performed similar to Fig. 3d, e. Sample sizes (n) are indicated. b, d, e, g and h each represents one out of three independent biological repeats that showed similar results (see Supplementary Table 6 for other repeats). Mean values of target to reference (ACT1) loci ratios were calculated by Poisson distribution based on 10,000 droplets with error bars representing upper and lower Poisson 95%CI.

