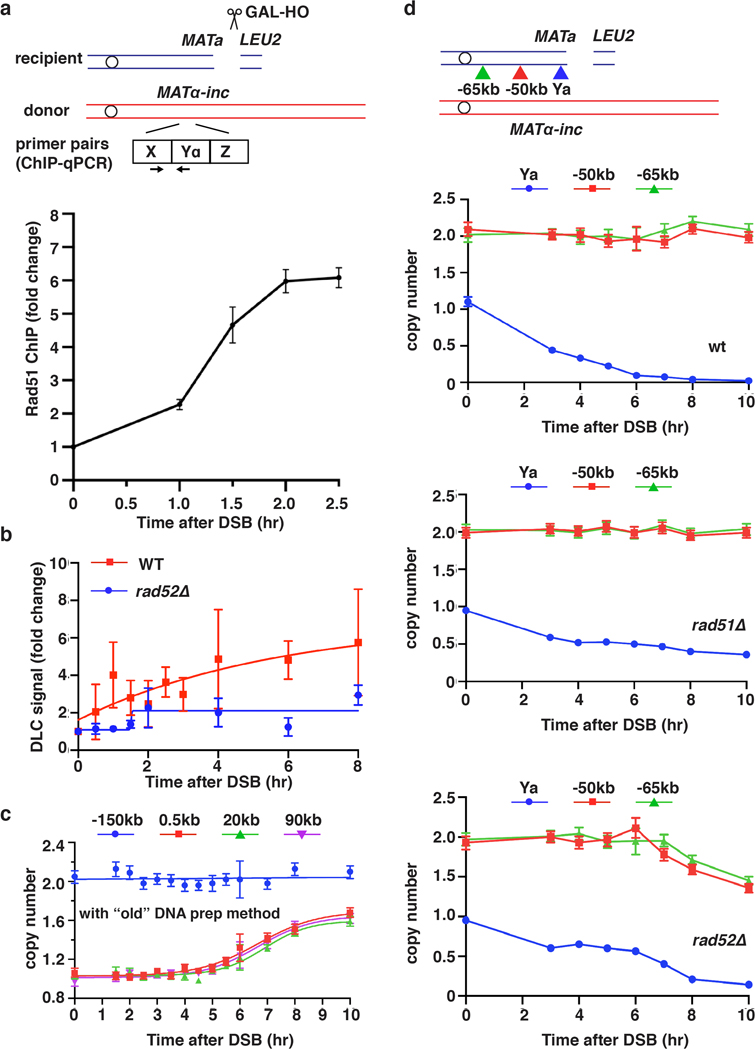
Extended Data Figure 1. Kinetics of DSB repair.
a, Strand invasion measured by Rad51 ChIP followed by qPCR. Forward primer is shared by donor and recipient at X region, and reverse primer is unique to the Yα region in the donor. The means ± SD (n=3 independent biological repeats) are indicated. b, Strand invasion measured by DLC assay. DLC signal is normalized to ARG4 and then compared to 0hr by fold changes. The means ± SD (n=3 independent biological repeats) are indicated. c, DNA synthesis detected by ddPCR using traditional DNA preparation protocol (see Methods). d, AMBER analysis of DNA clipping or degradation using primers located centromere proximal to MATa in wt (top), rad51Δ (middle), or rad52Δ (bottom) following DSB induction. In rad52Δ the rate of DNA degradation was >8kb/hr, much higher than in wt and rad51Δ. c and d each represents one out of three independent biological repeats that showed similar results (see Supplementary Table 6 for other repeats). Mean values of target to reference (ACT1) loci ratios were calculated by Poisson distribution based on 10,000 droplets with error bars representing upper and lower Poisson 95%CI.

