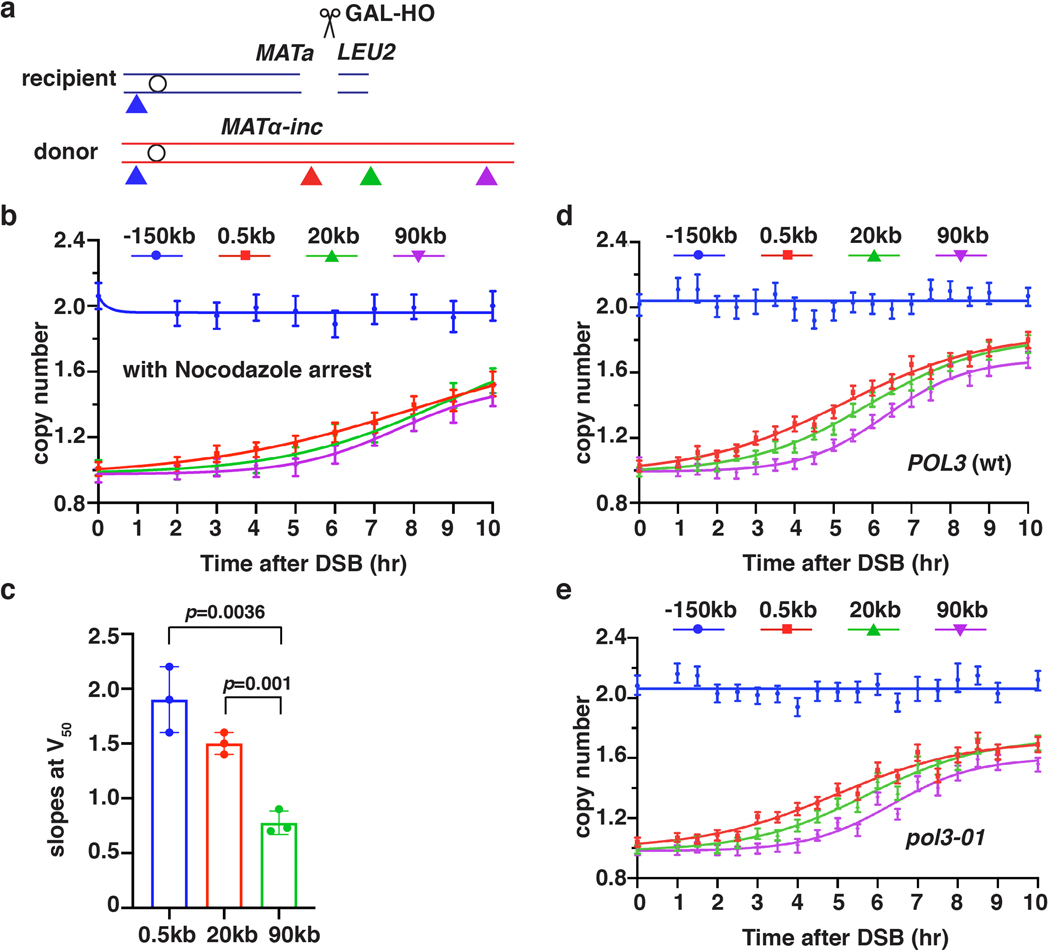
Extended Data Figure 2. Kinetics of BIR synthesis.
a, Schematic of primers (triangles) used for AMBER analyses (similar to Fig. 1a). b, DNA synthesis detected by AMBER in a time course designed as described in Fig. 1b, but with nocodazole addition 3 hours prior to DSB induction (0hr). The data represent one experiment that was similar to 3 experiments presented in Fig. 2b. c, Slopes of BIR at the time when 50 percent of the cells had completed BIR (V50) at the indicated chromosomal position based on three independent experiments (n=3), including the one shown in Fig. 1b. The means ± SD (error-bars) are indicated. Statistics is determined by two-tailed t-test with p value indicated. d, AMBER analysis of POL3 (wt), and e, pol3–01. b, d and e each represents one out of three independent biological repeats that showed similar results (see Supplementary Table 6 for other repeats). Mean values of target to reference (ACT1) loci ratios were calculated by Poisson distribution based on 10,000 droplets with error bars representing upper and lower Poisson 95%CI.

