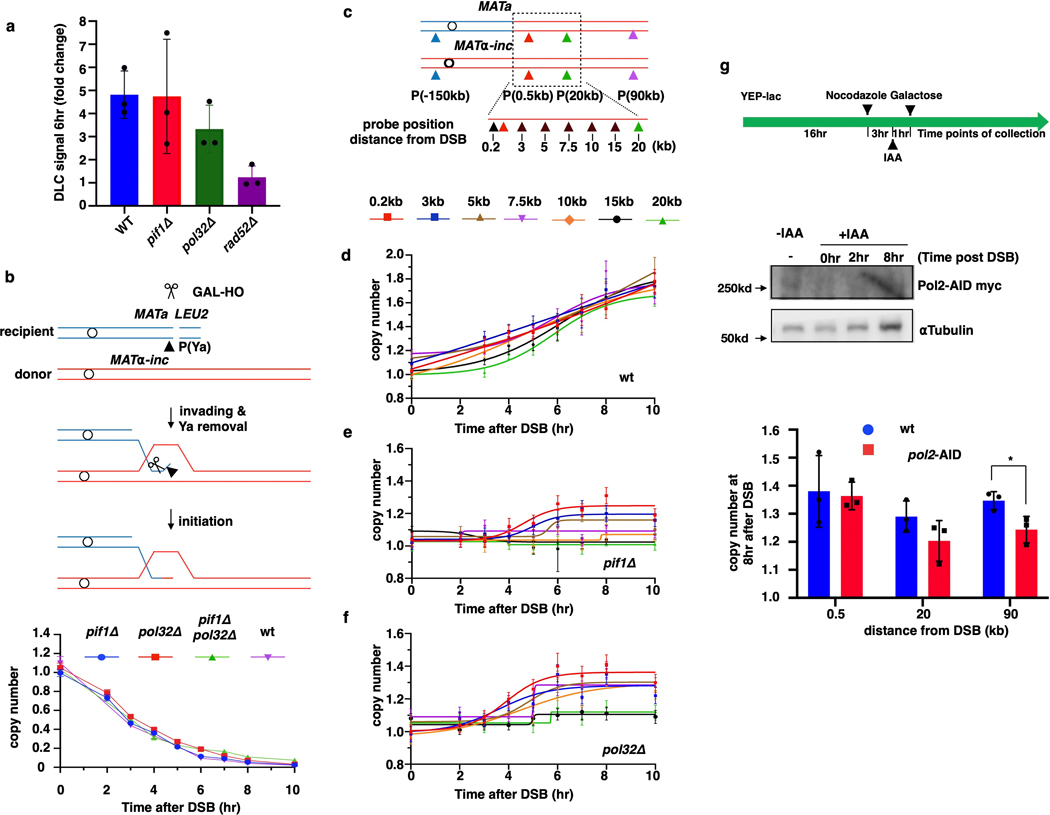
Extended Data Figure 3. BIR synthesis in pif1Δ, pol32Δ, and pol2-AID.
a, Strand invasion in pif1Δ and pol32Δ mutants 6h post DSB measured by DLC assay. DLC signal is normalized to ARG4 and compared to 0hr by fold changes. The means ± SD (n=3 independent biological repeats) are indicated. b, Kinetics of Ya disappearance in wt, pif1Δ, pol32Δ and pif1Δ pol32Δ. c, Schematic of primers used for AMBER analyses. d-f, AMBER analysis of BIR synthesis in wt (PIF1, POL32) (d), in pif1Δ (e), and pol32Δ (f). d-f each represents one out of three independent biological repeats that showed similar results (see Supplementary Table 6 for other repeats). Mean values of target to reference (ACT1) loci ratios were calculated by Poisson distribution based on 10,000 droplets with error bars representing upper and lower Poisson 95%CI. g, AMBER analysis of BIR synthesis following inactivation of Polε (pol2-degron) with schematic of analysis (top), degradation of AID-tagged Pol2 verified by Western Blot (middle) and calculation of copy number (bottom). The means ± SD (n=3 independent biological repeats) are indicated. * represents significant difference (p=0.0351) determined by t-test, two-tailed).

