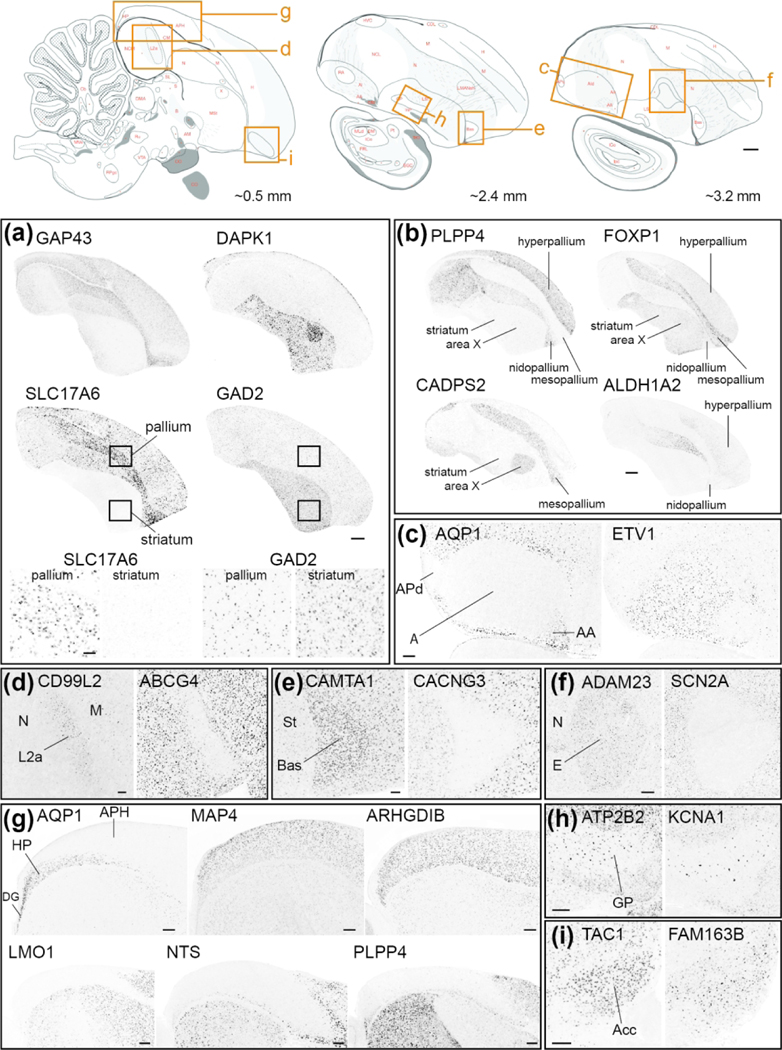
Figure 14. Comparative Neuroanatomy genes: telencephalon (Portal 4).
Top row: Schematic drawings of parasagittal sections of the adult male zebra finch brain depict major brain subdivisions and specific nuclei shown in this figure. Red letters and dots indicate structure annotations as they appear in ZEBrA, vermillion rectangles indicate the position of the images shown in other panels, and numbers at bottom right of each diagram provide position (in mm) relative to the midline. Other panels: Examples of in situ hybridization images of genes that show differential expression in various parts of the telencephalon, taken from the Bird Brain Markers (sub-portal 4A). (a) Markers showing differential enrichment in pallium (GAP43, SLC17A6) vs striatum (DAPK1, GAD2); the top and bottom small squares show the position of the left and right insets respectively, depicting pallial vs. striatal differences in cell labeling densities. (b) Markers showing differential enrichment in specific pallial subdivisions, including negative and positive markers of the mesopallium (PLPP4, CADPS2 and FOXP1) and nidopallium (ALDH1A2), in different combinations with St and Area X. (c) General negative/positive markers of the arcopallium (AQP1/ETV1, the latter also a negative marker of subdomains APd and AA). (d-f) Positive/negative markers of pallial thalamo-recipient zones L2a (CD99L2/ABCG4), nucleus basorostralis (CAMTA1/CACNG3) and entopallium (ADAM23/SCN2A). (g) Markers of the entire hippocampal formation (positive: MAP4, ARGHDIB; negative: LMO1, NTS) or parts thereof (AQP1, PLPP4). (h) Markers of the globus pallidus (ATP2B2, KCNA1). (i) Markers of the striatal nucleus accumbens (TAC1, FAM163B). For simplicity, only telencephalic structures are shown in (a) and (b). Abbreviations: A: arcopallium; Acc, nucleus accumbens; APH, parahippocampal area; Bas, nucleus basorostralis; DG, dentate gyrus; E, entopallium; GP, globus pallidus; H, hyperpallium; HA, apical part of the hyperpallium; Hp, hippocampus proper; L2a, subfield L2a with auditory Field L; M, mesopallium; N, nidopallium; St, striatum. For other abbreviations in top row diagrams, please consult the histological atlas in ZEBrA. Scale bars: top row diagrams = 1 mm; (a): low-power photomicrographs = 1mm, high-power insets = 100 μm; (b) = 1 mm; (c) = 400 μm; (d) and (e) = 200 μm; (f) – I = 400 μm.

