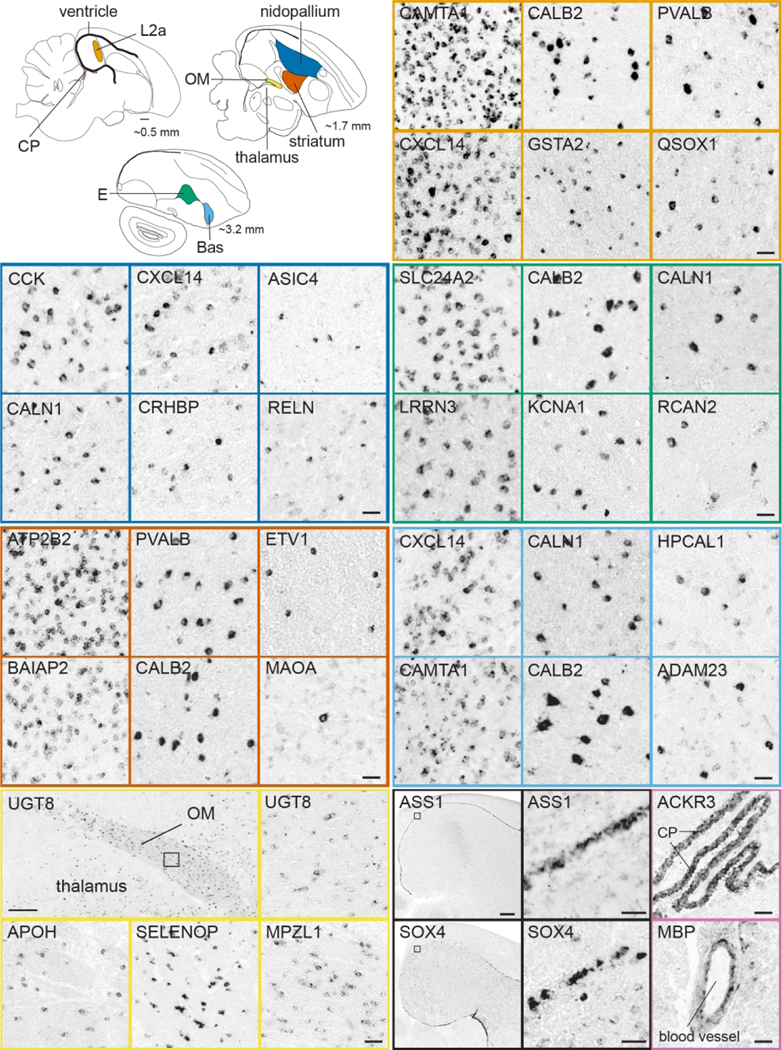
Figure 16. Comparative Neuroanatomy genes: cellular level (Portal 4).

Upper left: Schematic drawings of parasagittal sections of the adult male zebra finch brain depict the locations (colored regions) of the brain regions sampled in the in situ hybridizations images. Other panels: Examples of in situ hybridization images of genes that show high density of labeling (left panels for most brain areas) vs. sparse cell labeling (other panels) in pallium (dark blue), striatum (red), L2a (orange), Bas (light blue) or E (green), as well as markers of OM (yellow), ventricle (black), and choroid plexus and blood vessel endothelium (pinkish purple). Abbreviations: Bas, nucleus basorostralis; CP, choroid plexus; E, entopallium; L2a, subfield L2a within auditory Field L; OM, occipitomesencephalic tract. Scale bars: Top-row drawings = 1 mm; Low-power photomicrographs of UGT8 = 400 μm; ASS1 and SOX4 = 800 μm; all other panels = 50 μm.
