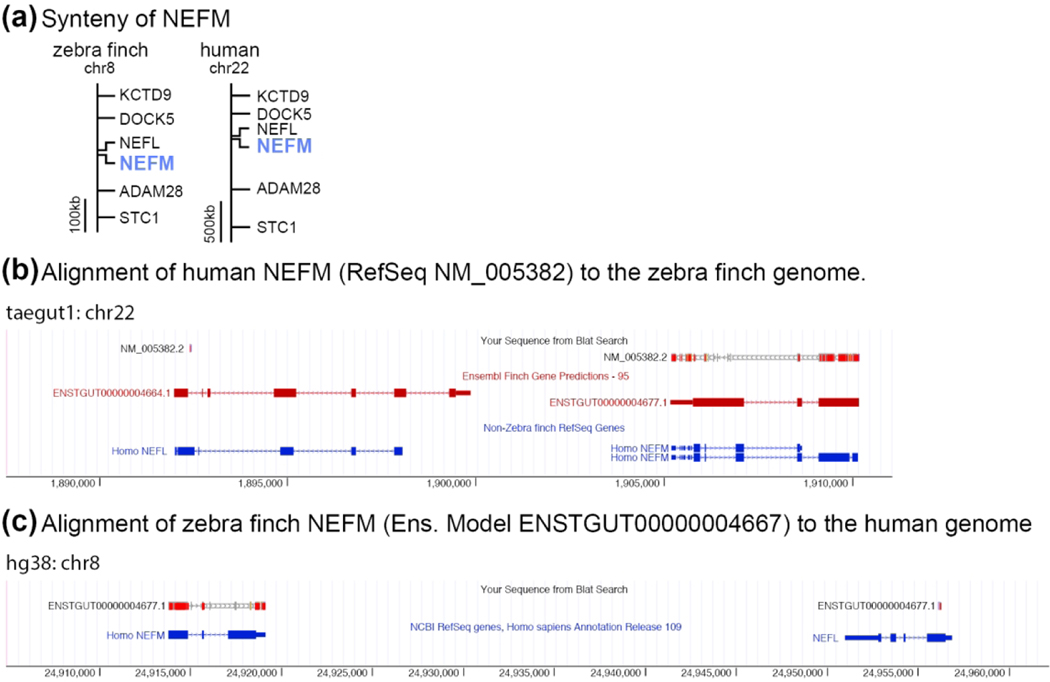
Figure 2. Gene Orthology Verification.
(a) Schematic depiction showing how conserved synteny establishes the one-to-one homology of zebra finch and human NEFM. (b-c) Screenshots from UCSC’s genome browser showing how NEFM gene predictions from zebra finch (Ensemble model ENSTGUT00000004667) and human (Refseq NM_005382.2) align to the correct loci with the highest reciprocal alignment scores. (b) Human NEFM (NM_005382.2) aligns to a region of the zebra finch genome containing NEFM (ENSTGUT00000004677.1) and NEFL (ENSGUT00000004664.1). The alignment of human NEFM has a higher scoring alignment, and more completely covers (i.e. higher exon coverage) the NEFM locus, than the NEFL locus (BLAT scores = 1085 vs. 25, respectively). (c) Zebra finch NEFM (ENSTGUT00000004677.1) aligns to a region of the human genome that contains NEFM and NEFL. The alignment of zebra finch NEFM model has a higher scoring alignment, and more complete coverage for the NEFM locus than for NEFL locus (BLAT scores = 1154 vs. 65, respectively).

