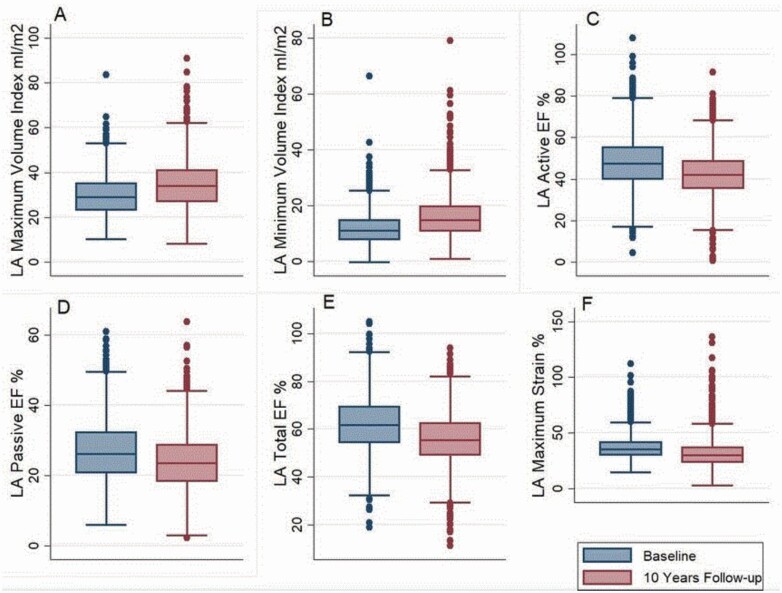
Figure 3.
Bar graph showing mean LA structural and functional parameters at baseline (blue) and 10-year follow-up (red). (a) LA Maximum Volume Index; (b) LA Minimum Volume Index; (c) LA Active EF; (d) LA Passive EF; (e) LA Total EF; (f) LA Maximum Strain. There is a statistically significant difference in the mean values of LA parameters at baseline and at 10-year follow-up using paired t-tests. Abbreviations: EF, emptying fraction; LA, left atrium.

