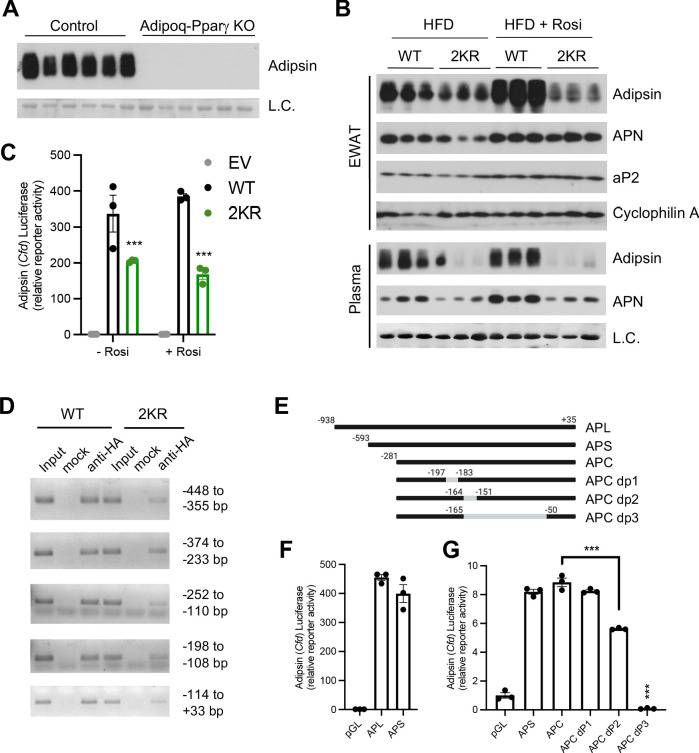
Figure 7. Adipsin is a downstream target of PPARγ deacetylation.
(A) Immunoblot of Adipsin in the plasma from adult male adipocyte conditional PPARγ KO (Adipoq-Pparγ KO) and control mice on HFD for 12 weeks (L.C. = Coomassie staining of the membrane). (B) Adult male WT and 2KR mice on HFD for 12 weeks followed by 8 weeks of HFD or HFD supplemented with rosiglitazone (Rosi). Immunoblots of Adipsin, Adiponectin (APN), and aP2 from epididymal white adipose tissue (EWAT) (loading control = cyclophilin A) and Adipsin and APN from plasma (L.C. = Coomassie stain of the membrane). (C) Adipsin promoter-driven luciferase reporter assay from HEK293T cells transfected with WT or 2KR overexpression of PPARγ with or without Rosi treatment (n = 3/group). (D) ChIP assay for PPARγ binding to the Adipsin promoter. Pparg-/- mouse embryonic fibroblasts (MEFs) were reconstituted with Flag-HA-tagged WT or 2KR PPARγ2 and adipogenesis was induced. Anti-HA ChIP assay was performed on day 7 of differentiation. (E) Scheme of Adipsin promoter designs: long Adipsin promoter (APL), short Adipsin promoter (APS), Adipsin promoter core (APC), delete −197 to −183 (dP1), delete −164 to −151 (dP2), delete −165 to −50 (dP3). (F, G) Adipsin promoter-driven luciferase reporter assay in HEK293T cells with various deletions in the Adipsin promoter region. ***p<0.001 for WT vs. 2KR. Data represent mean ± SEM. Two-tailed Student’s t-tests were used for statistical analyses.


