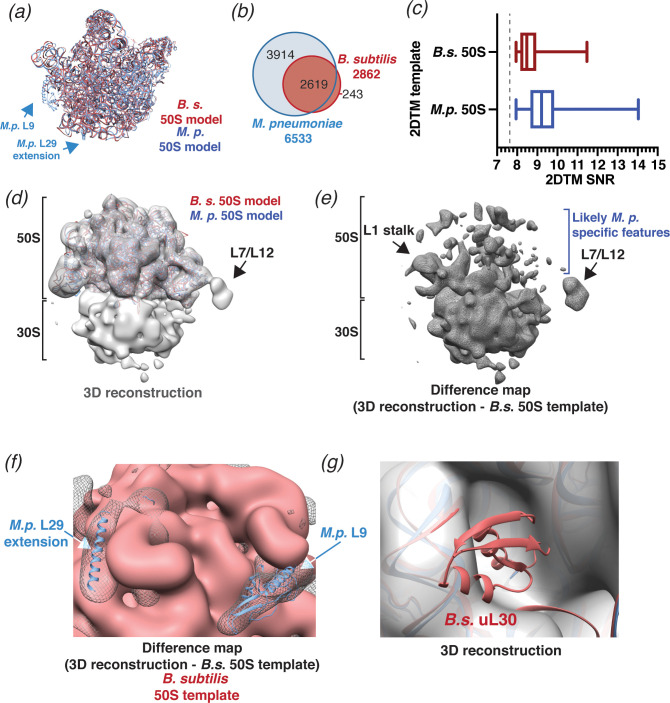
Figure 4. 2DTM using a B. subtilis 50S template reveals species-specific structures.
(a) Molecular models of B. subtilis (red) and M. pneumoniae (blue) 50S ribosomal subunits aligned using UCSF Chimera (Pettersen et al., 2004). (b) Venn diagram showing the number of 50S subunits detected in the same dataset of 220 images of M. pneumoniae cells using the indicated template. (c) Boxplot showing the distribution of 2DTM SNR values of the locations quantified in the diagram in (b). The width of the box indicates the interquartile range, the middle line indicates the median and the whiskers indicate the range. The dashed vertical line indicates the 2DTM SNR threshold used. (d) 20 Å filtered 3D reconstruction generated using the locations and orientations of 1172 50S subunits detected in 220 images using 2DTM with a B. subtilis 50S template, showing clear density for the 30S ribosomal subunit and L7/L12 (not included in the template). The threshold was selected to reflect the threshold used in Figure 3b and c. (e) Difference map showing the regions of the 3D reconstructions that differ from the 50S 2DTM search template. Arrows indicate additional density consistent with 70S ribosome structures. (f) Difference map as described in (e) (gray mesh), aligned to the B. subtilis 50S template (red) and both M. pneumoniae (M.p., blue) and B. subtilis (red, not visible) molecular models. The difference map is shown at the same threshold as in (d). (g) 3D reconstruction as described in (d) (transparent gray), aligned to M. pneumoniae (M.p., blue) and B. subtilis (B.s., red) molecular models.


