. 2021 Jun 22;10:e68830. doi: 10.7554/eLife.68830

Figure 5. ERK phosphorylation is required to produce pharyngeal progenitors.

(A) Western blot for phosphorylated ERK (pERK) and tubulin (loading control) in intact animals and at the indicated times after pharynx amputation. (B) Schematic of PD0325901 (PD) exposure relative to pharynx amputation for graph in C and images in D. (C) Proportion of animals capable of feeding after pharynx amputation, treated as indicated in B and assayed daily. Error bars represent ± 95% confidence intervals. n ≥ 47 animals from three independent experiments. (D) Whole-mount FISH for the pharynx marker laminin 7 days post-pharynx amputation (dpa) in animals treated as indicated in B. Dashed blue line outlines pharynx; dashed yellow line outlines mouth. Scale bars = 100 µm. n ≥ 18 animals from two independent experiments. (E) Confocal images of FISH for FoxA (green) and piwi-1 (magenta) 3 days post-pharynx amputation in animals treated with DMSO or PD (schematic). DAPI = DNA (blue); dashed box = region imaged; arrows = double-positive cells; scale bar = 10 µm. (F) Number of FoxApiwi-1+ cells 3 days post-pharynx amputation after indicated treatments (schematics E and F). (G) Confocal images of FoxA FISH (green) and H3P antibody (magenta) 2 days post-pharynx amputation in animals treated with DMSO or PD, 1 day after amputation for 24 hr. DAPI = DNA (blue); arrows = double-positive cells; scale bar = 10 μm. (H) Number of FoxA+ H3P+ cells 2 days post-pharynx amputation in animals treated with DMSO or PD (schematic). Bar graphs represent mean ± SD; symbols = individual animals; shapes distinguish biological replicates and; ***, p≤0.001; ****, p≤0.0001; one-way ANOVA with Tukey test (F), unpaired t-test (H). Raw data can be found in Figure 5—source data 1.

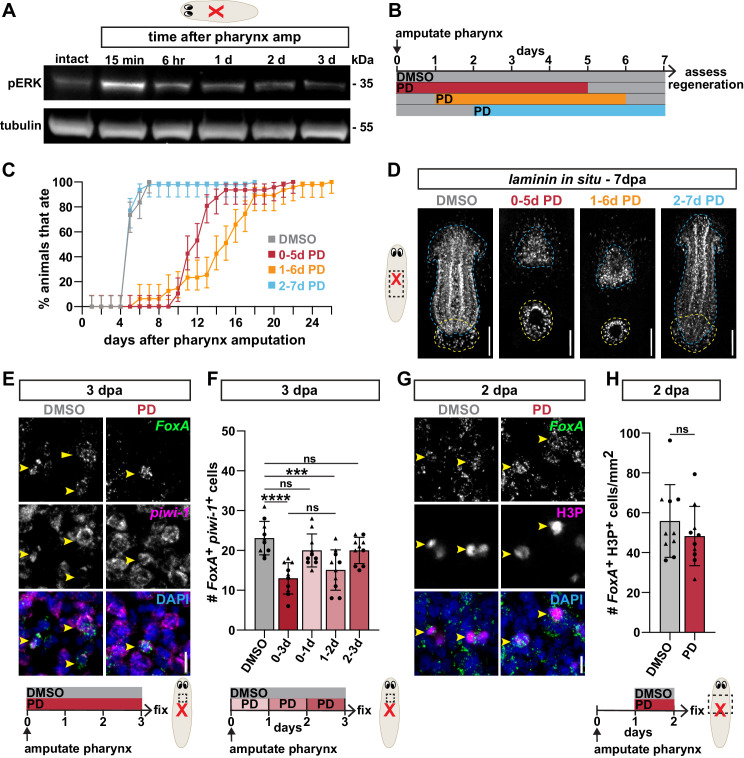
Figure 5—source data 1. Original, uncropped images of western blots in Figure 5A.
Figure 5—source data 2. Raw data for feeding assay (Figure 5C), quantification of piwi-1+ cells (Figure 5F) and H3P+ cells (Figure 5H).

Figure 5.

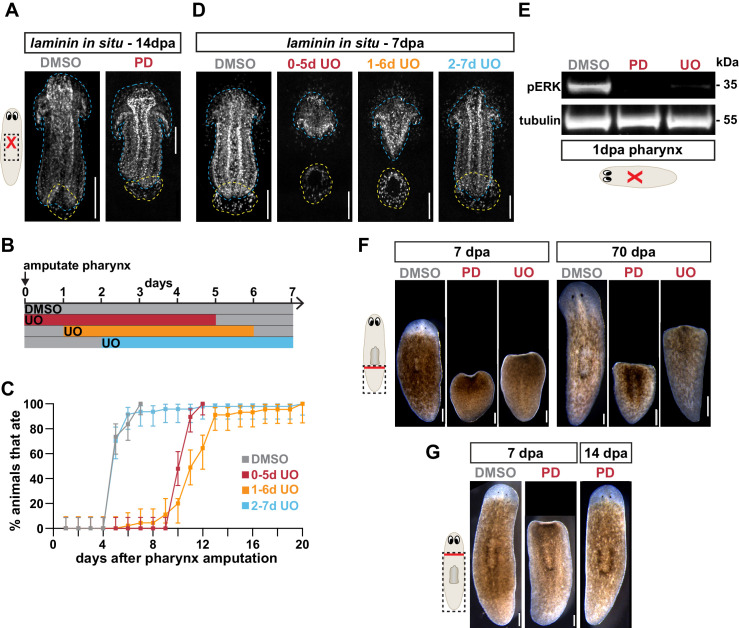
Figure 5—figure supplement 1. MEK inhibitors U0126 and PD0325901 prevent ERK phosphorylation and tissue regeneration.

Figure 5—figure supplement 1.

(A) Whole-mount FISH for the pharynx marker laminin 14 days post-pharynx amputation (dpa) in animals, treated with DMSO or PD0325901 (PD) for 5 days beginning immediately after amputation. Dashed blue line outlines pharynx; dashed yellow line outlines mouth; scale bars = 100 µm. n ≥ 33 animals from three independent experiments. (B) Schematic of UO126 (UO) exposure relative to pharynx amputation for graph in C and images in D. (C) Proportion of animals capable of feeding after pharynx amputation, treated as indicated in B and assayed daily. Error bars represent ± 95% confidence intervals. n ≥ 45 animals from three independent experiments. (D) Whole-mount FISH for the pharynx marker laminin 7 days post-pharynx amputation in animals, treated as indicated in B. Dashed blue line outlines pharynx; dashed yellow line outlines mouth; scale bars = 100 µm. n ≥ 14 animals from two independent experiments. (E) Western blot for phosphorylated ERK (pERK) and tubulin (loading control) 1 day post-pharynx amputation in animals treated with DMSO, PD, or UO beginning immediately after amputation. (F) Tail fragments of planarians treated with DMSO, PD, or UO for 5 days beginning immediately after amputation, and imaged 7 or 70 days after amputation. Scale bars = 250 µm. n ≥ 28 animals from three independent experiments. (G) Planarians treated with DMSO or PD for 5 days beginning immediately after head amputation, and imaged 7 or 14 days post-amputation. Scale bars = 250 µm. n ≥ 22 animals from two independent experiments. Raw data can be found in Figure 5—figure supplement 1—source data 1.
Figure 5—figure supplement 1—source data 1. Raw data for feeding assay in Figure 5—figure supplement 1C.
Figure 5—figure supplement 1—source data 2. Original, uncropped images of western blots in Figure 5—figure supplement 1E.
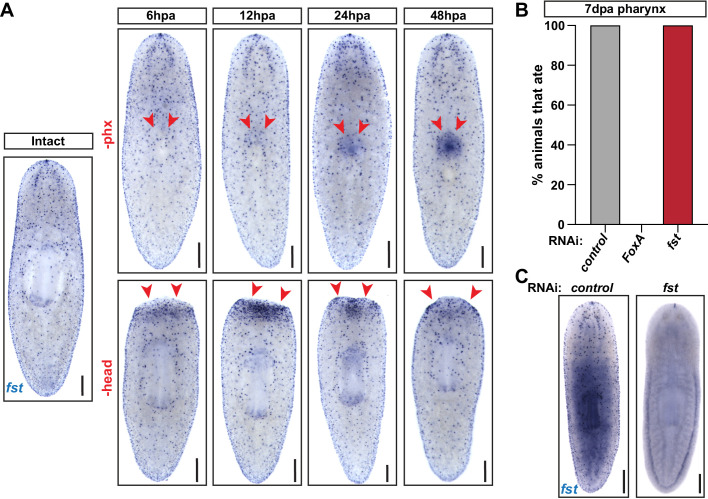
Figure 5—figure supplement 2. ERK-dependent pharynx regeneration is independent of follistatin.

Figure 5—figure supplement 2.

(A) Follistatin (fst) WISH in intact and injured animals, at the indicated hours post- pharynx or head amputation (hpa). Arrows = amputation site; scale bars = 250 µm. (B) Proportion of animals capable of feeding 7 days post-pharynx amputation (dpa), in control (unc-22), FoxA(RNAi) and fst(RNAi) animals. n ≥ 21 animals from two independent experiments. (C) fst WISH showing expression after knockdown. Scale bars = 250 µm. Raw data can be found in Figure 5—figure supplement 2—source data 1.
Figure 5—figure supplement 2—source data 1. Quantification of feeding behavior in Figure 5—figure supplement 2B.
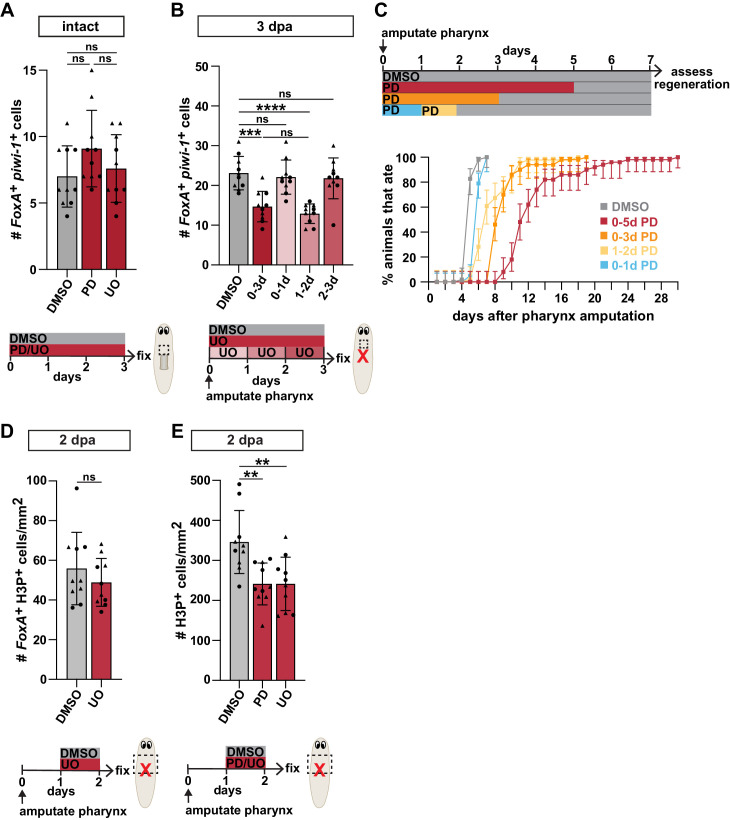
Figure 5—figure supplement 3. Inhibiting ERK phosphorylation reduces pharynx progenitors during regeneration.

Figure 5—figure supplement 3.

(A) Number of FoxApiwi-1+ cells in intact animals, treated with DMSO, PD0325901 (PD) or U0126 (UO) for 3 days (schematic). (B) Number of FoxApiwi-1+ cells 3 days post-pharynx amputation (dpa) after treatments with DMSO or UO (schematic). (C) Proportion of animals capable of feeding after pharynx amputation, treated with DMSO or PD as indicated (schematic) and assayed daily. Error bars represent ± 95% confidence intervals. n ≥ 46 animals from three independent experiments. (D) Number of FoxA+ H3P+ cells 2 days post-pharynx amputation in animals treated with DMSO or UO, 1 day after amputation for 24 hr (schematic). (E) Number of H3P+ cells 2 days post-pharynx amputation in animals treated with DMSO, PD, or UO, 1 day post-pharynx amputation for 24 hr (schematic). Bar graphs represent mean ± SD; symbols = individual animals; shapes distinguish biological replicates and; **, p≤0.01; ***, p≤0.001; ****, p≤0.0001; one-way ANOVA with Tukey test (A,B,E), unpaired t-test (D). Raw data can be found in Figure 5—figure supplement 3—source data 1.
Figure 5—figure supplement 3—source data 1. Raw data for quantification of piwi-1+ cells (Figure 5—figure supplement 3A and B), feeding assay (Figure 5—figure supplement 3C), and H3P+ cells (Figure 5—figure supplement 3D and E).