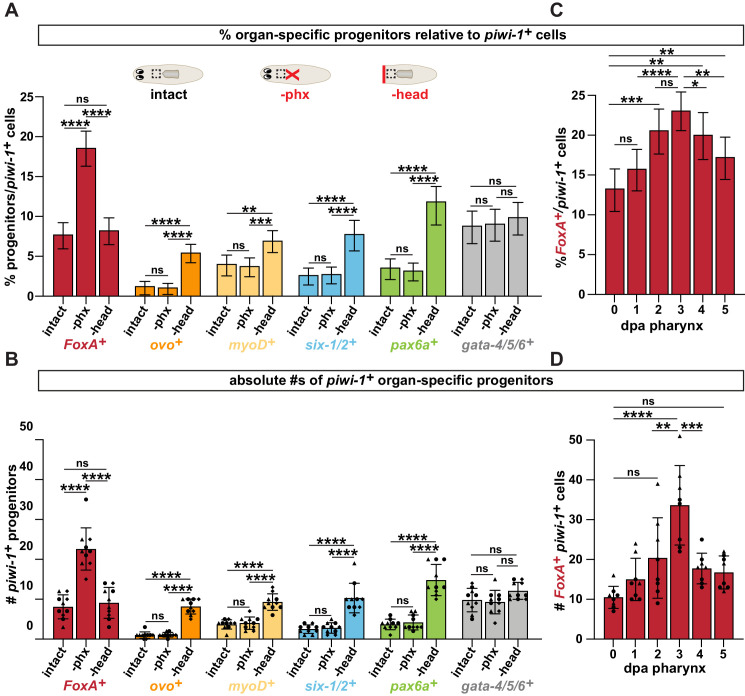
Author response image 1. Pharynx loss selectively increases pharynx progenitors in proportion to stem cells.
(A) Proportion of cells double positive for the indicated progenitor marker and piwi-1+ relative to all piwi-1+ stem cells in the area outlined by dashed boxes in cartoons. Cartoons depict different amputation conditions. n ≥ 790 cells per experimental group from 3 independent experiments. (B) Average number of FoxA+ piwi-1+ cells in the same animals and regions as A. Same data as is in Figure 2B, E of manuscript. (C) Proportion of FoxA+ piwi-1+ cells at indicated times post-pharynx amputation relative to all piwi-1+ stem cells in the area outlined by dashed boxes in A. n ≥ 631 cells per experimental group from 3 independent experiments. (D) Average number of FoxA+ piwi-1+ cells in the same animals and regions analyzed as C. Same data as in Figure 2C of manuscript. For all graphs a 6000μm2 region in the same location of the pre-pharyngeal region was analyzed over 20 z-sections, as represented by dashed boxes in A. Graphs represent a proportion ± 95% confidence intervals (A, C) or the mean ± SD with symbols = individual animals; shapes distinguish biological replicates (B, D). *, p ≤ 0.05 **, p ≤ 0.01; ***, p ≤ 0.001; ****, p ≤ 0.0001, Fisher’s Exact Test (A, C) or one-way ANOVA with Tukey test (B, D).

