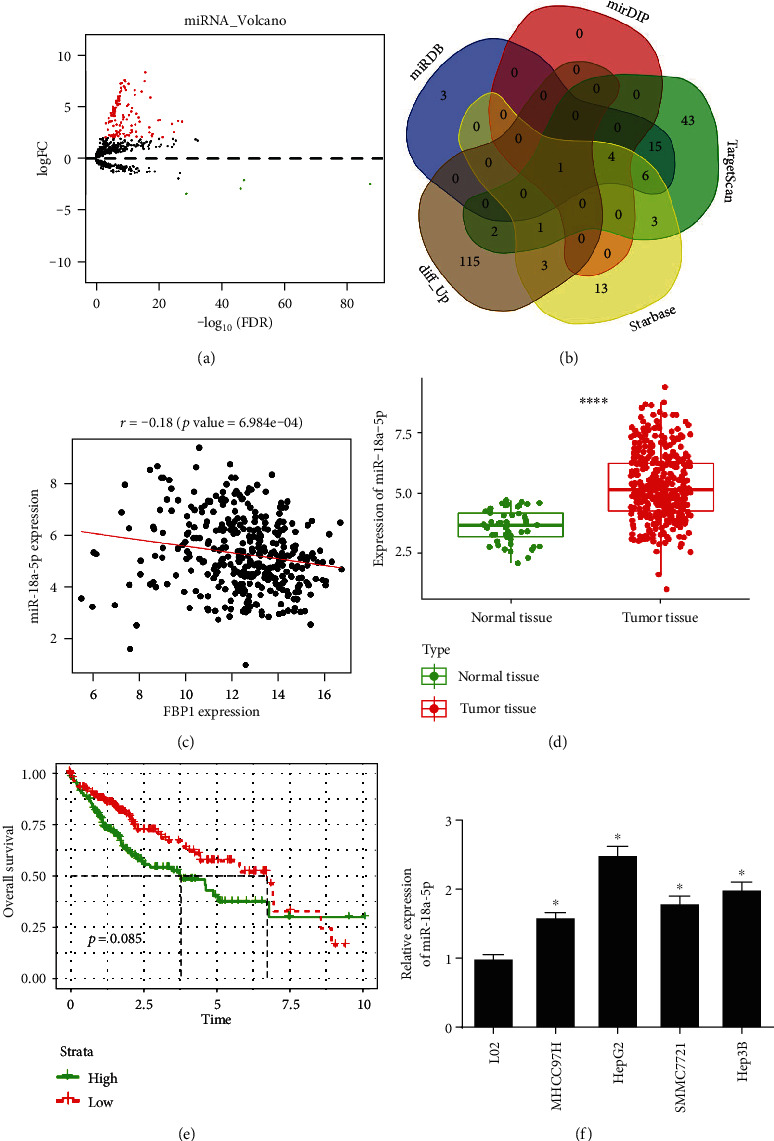
Figure 3.

miR-18a-5p is lowly expressed in liver cancer cells and negatively correlated with FBP1. (a) Volcano plot of DEmiRNAs in the normal group and the tumor group in liver cancer dataset in TCGA database, with red representing upregulated miRNAs and green representing downregulated miRNAs. (b) Venn diagram of predicted upstream miRNAs of FBP1 and DEmiRNAs. (c) Results of Pearson correlation analysis between FBP1 and its predicted upstream miRNAs (each dot represents a tumor sample). (d) Boxplot of the expression of miR-18a-5p, with green representing the normal group and red representing the tumor group. (e) Survival curve of the expression of miR-18a-5p on patient's prognosis, with the green line representing the high-expression group and the red line representing the low-expression group. (f) The expression of miR-18a-5p in human normal liver cell line (L02) and human liver cancer cell lines (MHCC97H, HepG2, SMMC7721, and Hep3B) detected by qRT-PCR; ∗ represents p < 0.05 and ∗∗∗∗ represents p < 0.0001.
