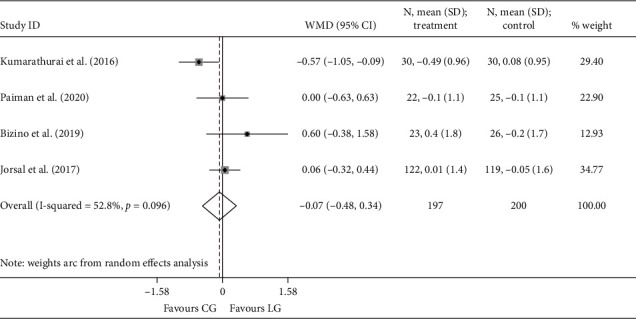
Figure 4.

Forest plot forΔe′. E′: the mitral annular early diastolic velocity; WMD: weighted mean difference; LG: liraglutide group; CG: control group.

Forest plot forΔe′. E′: the mitral annular early diastolic velocity; WMD: weighted mean difference; LG: liraglutide group; CG: control group.