
Figure 4.
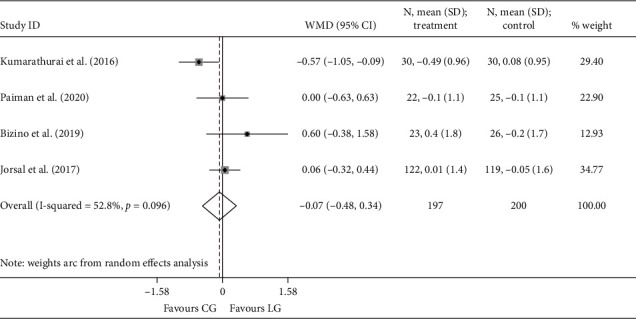
Forest plot forΔe′. E′: the mitral annular early diastolic velocity; WMD: weighted mean difference; LG: liraglutide group; CG: control group.
Official websites use .gov
A
.gov website belongs to an official
government organization in the United States.
Secure .gov websites use HTTPS
A lock (
) or https:// means you've safely
connected to the .gov website. Share sensitive
information only on official, secure websites.
Forest plot forΔe′. E′: the mitral annular early diastolic velocity; WMD: weighted mean difference; LG: liraglutide group; CG: control group.