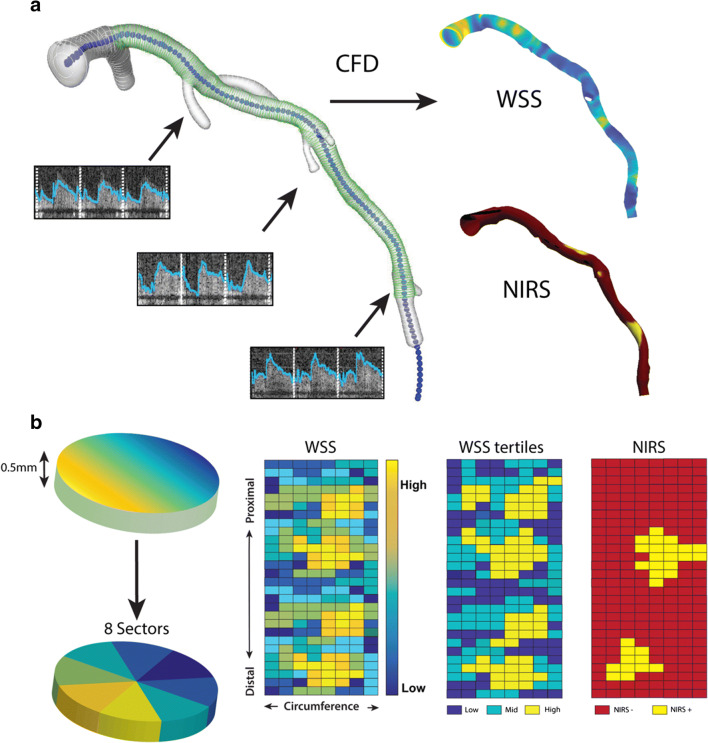
Fig. 1.
The methodology of the wall shear stress (TAWSS) calculations and analysis of near-infrared spectroscopy (NIRS). a IVUS contours (green, the region of interest) and CT contours (white) were matched and fused to make a surface of the 3D reconstruction. At different locations along the artery, flow measurements were done (arrows). Combined, these were used as boundary conditions for the computational fluid dynamics (CFD) and resulted in TAWSS. The NIRS signal was plotted onto the 3D reconstruction for co-localization analysis. b The artery was divided into cross-sectional disks of 0.5 mm perpendicular to the centerline of the vessel. These were divided into 8 45° sectors each. A 2D map was created, with on the x-axis, the circumference of the vessel, and on the y-axis, the distance along the centerline. For TAWSS, the 2D map sectors were divided into low, mid, and high TAWSS. A similar 2D map was created for binary NIRS data (yellow = NIRS positive (NIRS(+)), red = NIRS negative (NIRS(-))

