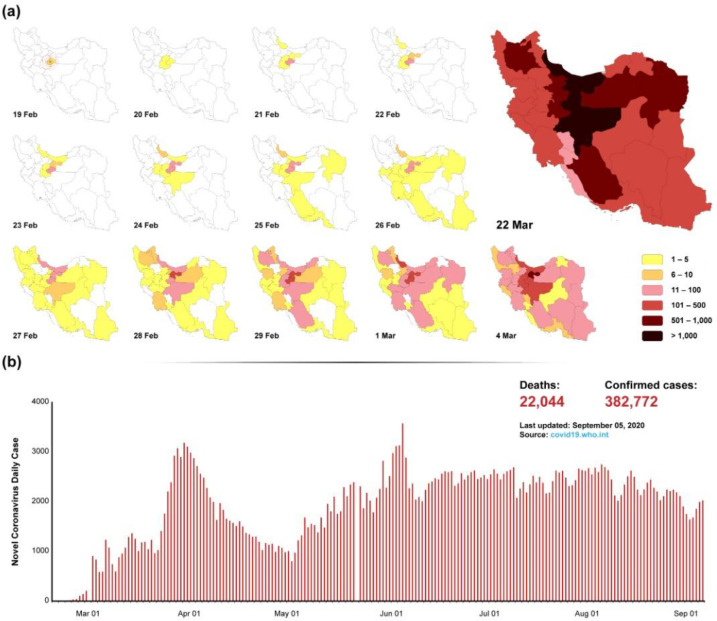
Fig. 2:
Distribution of infection by city and daily statistics. 2A) The distribution of infection is schematically illustrated by the province. The prevalence of the disease from the center to the outside can be considered. 2B) The daily incidence rate indicates the occurrence of the second wave, which occurred after the removal of the restrictions. Therefore, the third wave can be predicted according to the upward trend and the possibility of reopening schools.

