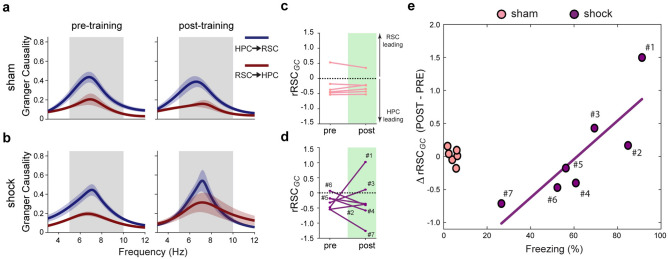
Figure 2.
Change in Granger causality (GC) estimates during REM sleep is related to fear memory expression. GC between HPC and RSC channels of rats from sham (a) and shock (b) groups during REM sleep pre- and post-CFC training. Data plotted in the frequency domain ranging from 3 to 12 Hz. Grey shade, theta range (5–10 Hz). (c,d) Relative RSC GC (rRSCGC) during REM sleep from pre to post periods. Data points are the difference on GC peak values within theta band between the RSC → HPC and HPC → RSC directions (i.e., rRSCGC = RSC → HPC—HPC → RSC). Black dashed line: no dominance/threshold for dominance inversion. Note that most of the animals show HPC dominance over RSC theta oscillation during pre for both sham (c) and shock (d) groups. Numbers represent animals from the shock group sorted from the highest to the lowest freezing during testing (# 1 to # 7). (e) Change in rRSCGC in the shock group (data points from d) from pre to post, defined as ∆rRSCGC, is positively correlated with freezing behavior assessed 24 h after CFC training (n = 7; R2 = 0.71; ρ = 0.93, p = 0.007; Spearman correlation). Data points represent the modulation of the strength of RSC → HPC dominance over the HPC → RSC direction from before to after training (post–pre) for individual rats (see “Methods”). Pink and purple represent sham and shock groups, respectively. Purple line: least-squares linear regression for the shock group data points. Graphs show mean ± SEM (lines ± shades).

