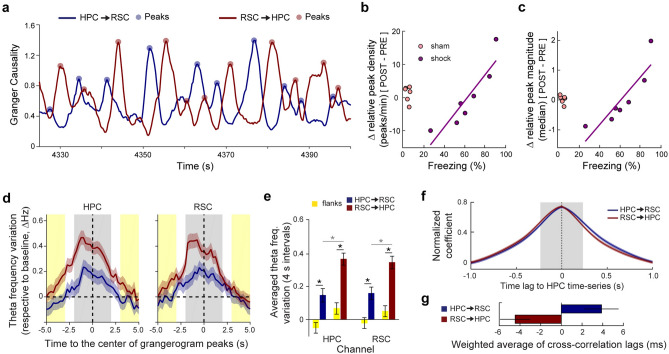
Figure 3.
Grangerogram peaks are informative about memory retrieval and are related to theta transient acceleration. (a) Smoothed (2-s rectangular kernel) maximum GC values within theta range (grangerogram) during exemplary REM sleep epoch. (b,c) The changes in relative grangerogram peak density (b) and magnitude (c) in the shock group from pre to post are positively correlated with freezing behavior during testing (density, n = 7: R2 = 0.82, ρ = 0.96, p = 0.003; and magnitude, n = 7: R2 = 0.77, ρ = 0.96, p = 0.003; Spearman correlation). Data points calculated as in Fig. 2e (see “Methods”). Purple line, least-squares linear regression for the shock group. (d) Average theta frequency variation across animals/periods in the HPC and RSC channels within time windows centered at grangerogram peaks (4 s, grey shadow). Yellow shadow, 4-s window (2-s each side) used as controls (flanks). (e) Theta frequency increases close to grangerogram peaks in the HPC and RSC channels (peaks n = 260 vs flanks n = 260. HPC channel: HPC → RSC: t(259) = − 4.6, p = 0; RSC → HPC: t(259) = − 6.6, p = 0. RSC channel: HPC → RSC: t(259) = − 4.3, p = 0; RSC → HPC: t(259) = − 6.7, p = 0), and is even higher in the vicinity of RSC → HPC compared to HPC → RSC peaks (RSC → HPC n = 260 vs HPC → RSC n = 260; HPC channel: t(518) = − 3.9, p = 0. RSC channel: t(518) = − 3.3, p = 10–4). (f) Average cross-correlation functions between HPC and RSC instantaneous theta frequency in the vicinity of grangerogram peaks (Supplementary Fig. S7a–e). Grey shadow, window that maximizes the difference between directions (± 234 ms; Supplementary Fig. S7h). (g) The weighted average of cross-correlation functions in (f) shows that the precedence of theta acceleration between regions is dependent on grangerogram direction (HPC → RSC: + 3.9 ± 1.6 ms and RSC → HPC: − 4.5 ± 1.4 ms respective to HPC; HPC → RSC, n = 238; RSC → HPC, n = 239, outliers excluded if outside Mean ± 2 × STD, t(473) = 3.8, p = 10–4; see “Methods” and Supplementary Fig. S7f,g). *p < 0.05. Graphs show mean ± SEM (lines/bars ± shades/lines). Spearman correlation in (b,c). paired t test in [(e), comparison with flanks]. unpaired t test in [(e, between directions) and (g)].

