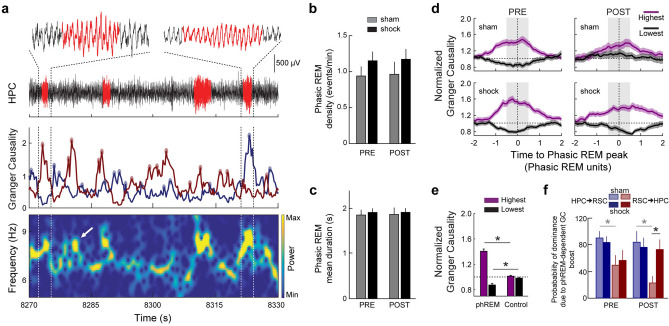
Figure 4.
Phasic REM events are related to transient modulation of granger causality. (a) Phasic REM (phREM) events in relation to the simultaneous grangerogram time series and HPC spectrogram. Top, HPC LFP raw trace in black, phREM events in red. Insets, zoom in (3-s window) on representative phREM events in which the RSC leads HPC theta (left) and HPC leads RSC theta (right). Grey dashed lines highlight insets across all plots. Middle, grangerogram time series and their selected peaks (dots). Bottom, HPC spectrogram showing the characteristic transient theta acceleration related to phREM events. White arrow, exemplary transient theta acceleration synchronous with a grangerogram peak, which was not detected as a phREM event. (b,c) No difference was found in phREM mean density among groups or periods (Sham, n = 6, Shock, n = 7; pre vs post: sham, p = 0.56; shock, p = 0.94. sham vs shock: pre, p = 0.29; post, p = 0.36; (b) or duration (Sham, n = 6, Shock, n = 7; pre vs post: sham, p = 0.32; shock, p = 0.68. sham vs shock: pre, p = 0.62; post, p = 0.52; (c). (d) Grangerograms centered at phREM events, normalized by phREM length (x-axis), by each respective baseline grangerogram (y-axis), and averaged across groups/periods. Plot shows the difference in GC modulation between the directions with highest and the lowest values (see “Methods”). Black dashed lines: vertical, center of phREM events; horizontal, baseline. (e) The GC averaged across one phREM unit (d, grey shadow) is significantly upmodulated in the highest direction and downmodulated in the lowest direction as compared with controls centered at random data points (n = 396/group. Highest: phREM × control, t(790) = 10.8, p = 10–25; Lowest: phREM × control, t(790) = − 4.0, p = 10–5; unpaired t test). Black dashed line, baseline. (f) The likelihood that the HPC will lead the RSC theta oscillation due to phREM-dependent GC upmodulation shows a trend to be higher than the opposite direction for both groups, although only reaching significance for the sham group (Sham, n = 6, Shock, n = 7; HPC → RSC vs RSC → HPC: pre-sham, p = 0.04; pre-shock, p = 0.23; post-sham, p = 0.006; post-shock, p = 0.87; Wilcoxon signed rank test). No significant differences was found between groups, except in the RSC → HPC direction during post, in which the probability of group shock is higher than sham (Sham, n = 6, Shock, n = 7; sham vs shock: HPC → RSC-pre, p = 0.26; RSC → HPC-pre, p = 0.90; HPC → RSC-post, p = 0.63; RSC → HPC-post, p = 0.04; Wilcoxon rank-sum test). *p < 0.05. Graphs show mean ± SEM (lines/bars ± shades/lines).

