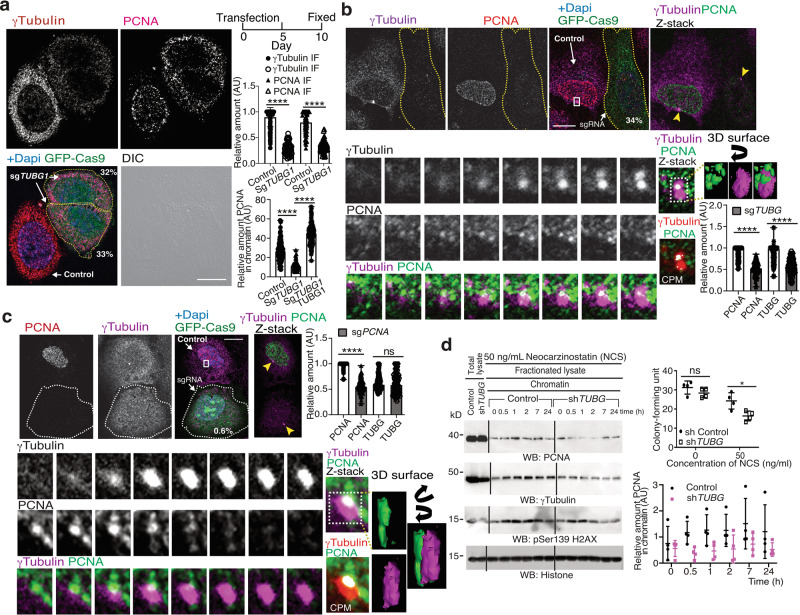
Fig. 3. The nuclear levels of γ-tubulin regulate the recruitment of PCNA to the nuclear compartment.
a–c The differential interference contrast (DIC)/fluorescence (a) images show U2OS cells expressing human TUBG-sgRNA (a, b) or PCNA-sgRNA (GFP-Cas9) for 10 days (c) that were synchronized in early S phase by double thymidine block and then released for 5 h (b, c). Localization of endogenous γ-tubulin and PCNA was examined by immunofluorescence staining with the indicated antibodies, and nuclei were detected with DAPI in U2OS or in U2OS cells expressing the following constructs: TUBG-sgRNA (a, b), PCNA-sgRNA (c), and co-expressing TUBG-sgRNA and a sg-resistant TUBG1 (a). Scale bars: 10 μm (N = 6). Z-stacks show average intensity projection of sequential images (b 14, c 13) that were collected at 0.2-μm intervals. The cropped image stack of the centrosome and the interacting PCNA foci were visualized in a 3D surface image with the 3D viewer plugin of ImageJ70. The 3D surface image obtained was rotated according to the direction of the black arrows. a Within samples, quantification of γ-tubulin and of the PCNA signal in chromatin was done with the ImageJ software by comparison of immunofluorescence-labeled γ-tubulin and PCNA either in asynchronous (a) or in synchronous (b, c) cells expressing Cas9-crispGFP (dashed lines; a sgTUBG1, N = 52 cells; b sgTUBG1, N = 100 cells; c sgPCNA, N = 102 cells) with non-expressing cells (a control, N = 100 cells; b control, N = 100 cells; c control, N = 102 cells) or with cells co-expressing TUBG-sgRNA and a sg-resistant TUBG1 (addback, N = 101 cells). The graphs illustrate the mean value of γ-tubulin and of the PCNA signal in chromatin (mean ± SD; ****P < 0.0001; see also Supplementary Fig. 3). a, b Numbers in images indicate the remaining protein levels of γ-tubulin or PCNA relative to control in the indicated cells. b, c White boxes indicate the magnified area shown in the insets. Sequential inset images illustrate the interaction of the centrosome with one of the PCNA foci. Colocalization pixel maps (CPM) represent the magenta/red and green channels of the magnified areas displayed in the inset. White areas denote colocalized pixels between channels. Arrowheads indicate centrosomes. d Control U2OS cells or U2OS cells stably expressing TUBG short hairpin RNA (shRNA) were treated and biochemically fractionated as in Fig. 2b and analyzed by western blotting (WB) with the indicated antibodies (see also Supplementary Fig. 1). The graphs illustrate the colony-forming unit of the cell populations after NCS treatment (mean ± SD; N = 3, *P < 0.05; top) and the relative densitometric analysis of the γ-tubulin and the PCNA chromatin content in the illustrated WBs (mean ± SD; N = 4, **P < 0.01; bottom). To adjust for differences in protein loading, the concentration of a protein was determined as its ratio with histone for each time point (see also Supplementary Fig. 4). a, d Source data are provided in Supplementary Data 1.

