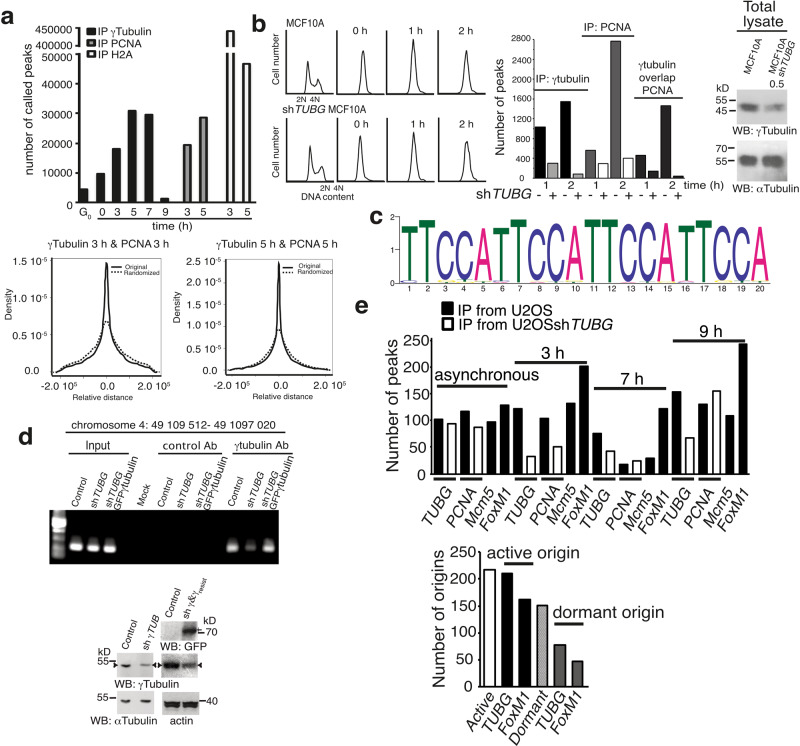
Fig. 4. PCNA and γ-tubulin bind to chromatin on the same DNA-binding motif.
a U2OS cells were synchronized in G0/G1 or in early S phase (0 h) and then released for 3 and 5 h (S) or 7 (S–G2/M) and 9 h (G2/M). To identify the locations where γ-tubulin, PCNA, and macro histone 2A (H2A) accumulate in the chromatin, we sequenced the DNA-associated with chromatin immunoprecipitates from these proteins (γ-tubulin: G0, 0, 3, 5, 7, and 9 h; PCNA and H2A: 3 and 5 h). The graphs show the number of binding sites (peaks called; top) found in the human genome to which an indicated protein binds or the distance distributions between a γ-tubulin peak and the PCNA peak closest to it (bottom). b MCF10A and MCF10A cells stably expressing TUBG shRNA (MCF10AshTUBG) were synchronized in early S phase (0 h) and released for 1 and 2 h. Cell cycle progression was monitored by determining the DNA content of cells (graphs; N = 3). Total lysates from MCF10A and MCF10AshTUBG were analyzed by WB for the expression of endogenous γ-tubulin and α-tubulin (loading control; N = 3). The numbers above the blots (WB) indicate the level of depletion of γ-tubulin relative to control. To adjust for differences in protein loading, the concentration of γ-tubulin was determined as its ratio with α-tubulin. To map the DNA region where γ-tubulin accumulates in the chromatin, we sequenced the DNA associated with chromatin immunoprecipitates from γ-tubulin and PCNA. Graphs show the number of peaks called in the human genome where γ-tubulin or PCNA accumulates or for which γ-tubulin and PCNA peaks overlapped at the indicated times (see also Supplementary Fig. 5). c Scheme of the significantly enriched purine-rich element binding protein A (PURA) DNA-binding motif found in the chromatin-associated with immunoprecipitates of γ-tubulin that overlapped with PCNA at 1 h. d U2OS, U2OSshTUBG, and U2OSshTUBG cells expressing a shTUBG-resistant GFP-γ-tubulin1 were analyzed by ChIP using an anti-γ-tubulin antibody. PCR primers amplified the indicated region (N = 3). e The DNA-associated with chromatin immunoprecipitates from γ-tubulin, PCNA, Mcm5, and FoxM1 from asynchronous and synchronized U2OS and U2OSshTUBG cells as in Fig. 4a and then released for 3 (S) and 7 h (S–G2/M) or 9 h (G2/M) was sequenced. Active origins are Mcm5 peaks that overlap with PCNA peaks, and dormant are those Mcm5 peaks that do not overlap with PCNA. The graphs show the number of peaks called in the human genome to which an indicated protein binds at the indicated time (top) or the number of origins of replication where γ-tubulin and FoxM1 were found (bottom), respectively (N = 2; see also Supplementary Table 1). b, d Source data are provided in Supplementary Data 1.

