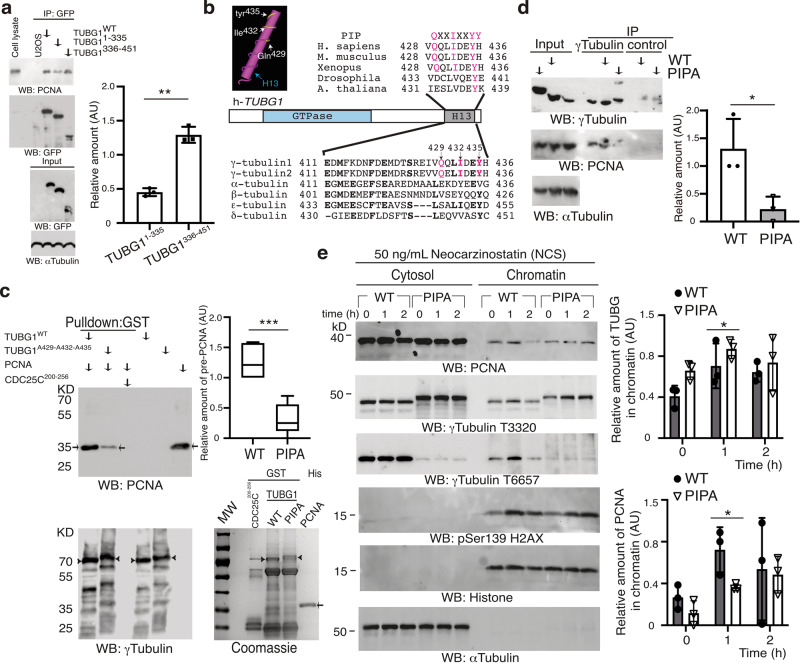
Fig. 6. The γ-tubulin C terminus interacts with PCNA.
a Extracts from U2OS cells, or such cells stably coexpressing TUBG-shRNA and GFP-γ-tubulin, GFP-N-γ-tubulin1–335, or GFP-C-γ-tubulin336–451 were used, and GFP was immunoprecipitated with an anti-GFP antibody and developed by WB with the indicated antibodies (N = 3). b Sequence alignment of the C-terminal α-helix (H13) region of human γ-tubulin 1 and γ-tubulin 2 and α-, β-, ε-, and δ-tubulin. Bold letters indicate identical residues. Magenta letters represent residues included in the PIP. The known 3D structure of the C-terminal H13 region of human γ-tubulin revealed with the 3D structure viewer Cn3D. Important amino acids are highlighted in white. c Purified His-PCNA (arrows) was incubated with one of the following glutathione Sepharose affinity resin-bound GST-tagged proteins (arrowheads): γ-tubulin (TUBG1WT; WT), γ-tubulinA429-A432-A435 (TUBG1A429-A432-A435; PIPA), or CDC25C200–256. Thereafter, the bound His-PCNA was examined by WB and the mean value of the PCNA signal (determined as its ratio with WT or PIPA) is represented in the graph (mean ± SD; N = 5, ***P < 0.001). Total amounts of loaded proteins were analyzed by WB and Coomassie staining. d Extracts from U2OS cells or U2OS cells co-expressing stably TUBG1-sgRNA and either γ-tubulinresist (WT) or a γ-tubulinA429-A432-A435resist (PIPA) were used, and γ-tubulin was immunoprecipitated with an anti-γ-tubulin antibody and developed by WB with the indicated antibodies (N = 3). a, d One-tenth of the total lysates used for immunoprecipitation was analyzed by WB (Input). The graphs illustrate densitometric analysis of the PCNA content in the indicated protein immunoprecipitates in the presented WBs. To adjust for differences in protein loading, the concentration of a protein was determined as its ratio with the immunoprecipitated protein (N = 3). e Extracts from neocarzinostatin-treated U2OSsgTUBG1-TUBG1WT (WT) and U2OSsgTUBG1-TUBG1A429-A432-A435 (PIPA) cells were prepared as in Fig. 2b and examined by WB using the indicated antibodies against PCNA, γ-tubulin, phospho-histone2AX, α-tubulin, and histone. The two graphs illustrate the mean values of the γ-tubulin and the PCNA signal in chromatin. To adjust for differences in protein loading, the concentration of a protein was determined as its ratio with histone for each time point (mean ± SD; N = 3, *P < 0.05). a, c–e Source data are provided in Supplementary Data 1. See also Supplementary Fig. 8.

