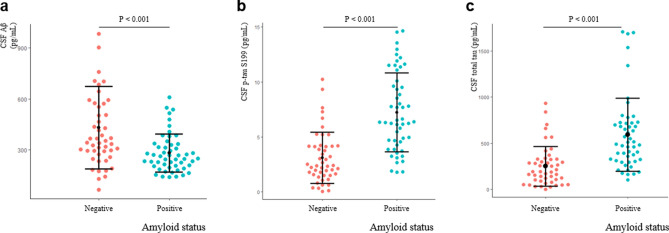
Figure 1.
Alzheimer’s disease (AD) biomarkers in the cohort. To demonstrate that the cohort had typical AD biomarker patterns, the levels of CSF Aβ42, T-tau, and P-tau S199 were compared between the two groups. Aβ42 levels were significantly lower in the amyloid-positive group than those in the amyloid-negative group (a). The cerebrospinal fluid (CSF) P-tau S199 (b) and T-tau (c) levels were significantly higher in the amyloid-positive group than those in the amyloid-negative group. Statistical analysis was performed using the Mann–Whitney test. sTREM2 soluble triggering-receptor expressed on myeloid cells 2, NfL neurofilament light chain, NRGN neurogranin. Statistical significance *P < 0.05, **P < 0.01.

