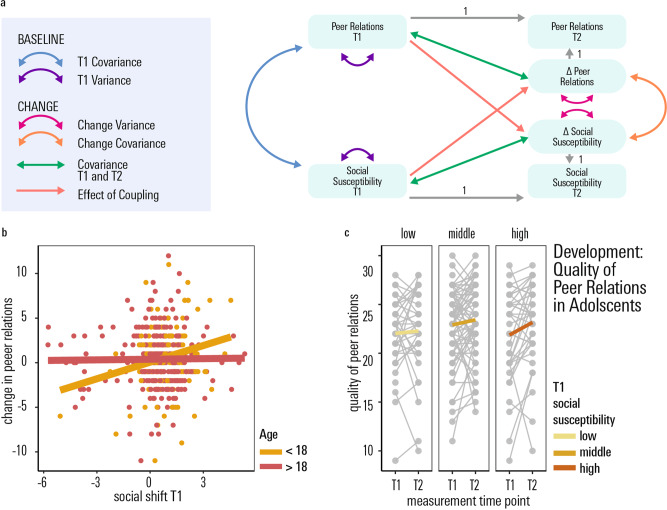
Fig. 3. Social susceptibility and the development of peer relations.
a Schematic of the latent change score model of the longitudinal development of social susceptibility in our task, the longitudinal development of real-life psycho-social functioning (perceived quality of peer relations) from baseline to long follow-up (~1.5 years later) as well as their co-development. Social susceptibility at time point 1 significantly predicts an increase in the quality of peer relationships within the follow-up period. b This positive association was driven by the younger (< 18 years old) people in our sample, but was not significant in those aged 18 or older. The full set of parameter estimates is included in the Supplementary Table 1. Error bands denote the 95% confidence level interval. c Change in the quality of peer relations in the adolescent subgroup (<18 years), plotted as a function of T1 Social susceptibility. T1 measurement time point 1, baseline assessment; T2 measurement time point 2, follow-up assessment after ~1–5 years. Source data are provided as a Source Data file.

