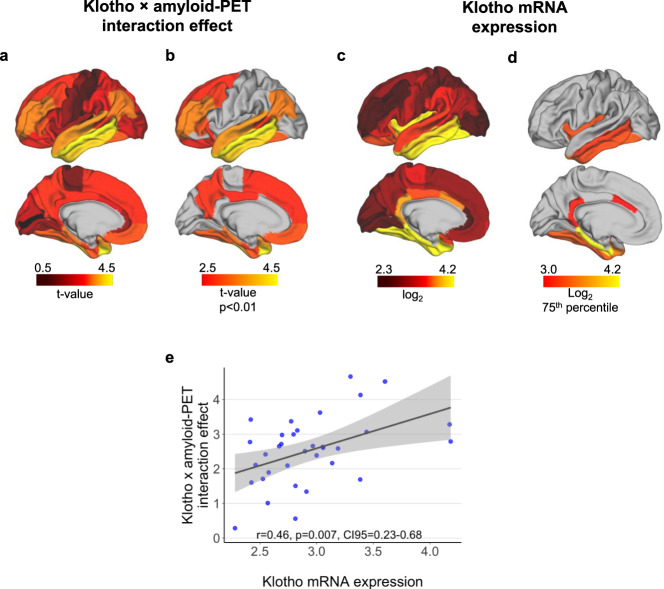
Fig. 2. Spatial patterns of KL-VShet-related attenuation of tau-PET and Klotho mRNA expression.
a Surface mapping of the interaction effect between KL-VShet and amyloid-PET levels on tau-PET accumulation within 34 left-hemispheric regions of the Desikan–Killiany atlas. Yellow colors indicate higher t-values reflective of a stronger interaction effect (all t-values inverted for illustration purpose; see Supplementary Table 2 for details statistical results). b Thresholded spatial map color-code only regions with a significant (p < 0.01, unadjusted for multiple comparisons) KL-VShet × amyloid-PET interaction effect. c Surface mapping of median KL mRNA expression (i.e., log2 derived from the Allen Brain Atlas) within the identical 34 atlas regions. Yellow colors indicate higher KL mRNA expression. d Thresholded spatial maps restricted to regions falling above the 75th percentile of KL mRNA expression. e Scatterplot depicting the association between ROI-based KL mRNA expression and KL-VShet × amyloid-PET interaction effect on regional tau-PET uptake. Statistical results are derived from the Pearson correlation (two-sided). Linear model fits are indicated together with 95% confidence intervals. Source data are provided as a Source Data file.

