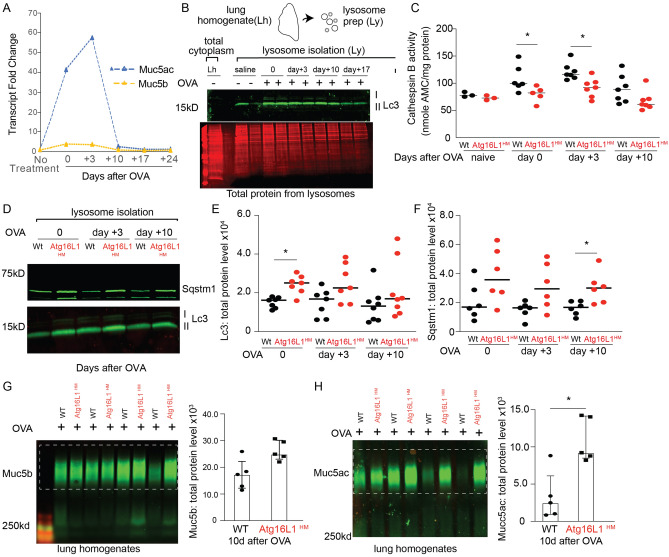
Figure 5.
Atg16L1 deficient mice have slower resolution of mucous metaplasia following Type 2 airway inflammation. (A) Muc5ac and Muc5b expression levels were measured by qRT-PCR from a representative WT mouse lung homogenate in a time course experiment at 0, 3, 10, 17, and 24 days after the last OVA treatment. Data reported as fold change vs. non-treated mice (N = 4 for timepoints 0, 3, and 10 and n = 1 mouse at day 17 and 24). (B) Representative Lc3 immunoblot from whole lung homogenates (Lh) or after lysosome isolation (Ly) was performed from WT mouse lung homogenates ± OVA sensitization and challenge and then day 0, 3 and 10 from last OVA challenge with total protein stain shown below. (n = 2 per group) (C) Cathepsin B proteolytic enzyme activity was measured from isolated lysosome fractions (Ly) from mouse lung homogenates ± OVA. Enzyme activity normalized by total protein (n = 2 per group for naïve mice and n = 6 per group at day 0 and 7 per group at days 3 and 10 after OVA. (D) Representative Lc3 and Sqstm1 immunoblots from WT and Atg16L1HM mouse lung lysosomes at day 0,3, and 10 from last OVA challenge. Quantification of Lc3 II (E) and Sqstm1 (F) according to time from last OVA challenge from WT and Atg16L1HM lysosomal isolates (N = 7 mice per group). (G, H) Representative immunoblots of Muc5b and Muc5ac by lectin Uea-1 from WT and Atg16L1HM mouse lung homogenates at 10 days after last OVA challenge with corresponding quantification. Mucin band density values normalized to total protein levels. (n = 5 mice per group). Graphs show scatter plots with median bar for cathepsin activity and Lc3/Sqstm1 western blotting and scatter plots with median bar and interquartile range for mucin blots. Significant difference by Mann–Whitney * for genotype difference of cathepsin B activity, Lc3, Sqstm1 immunoblots, and mucin blots in parts (G) and (H).

