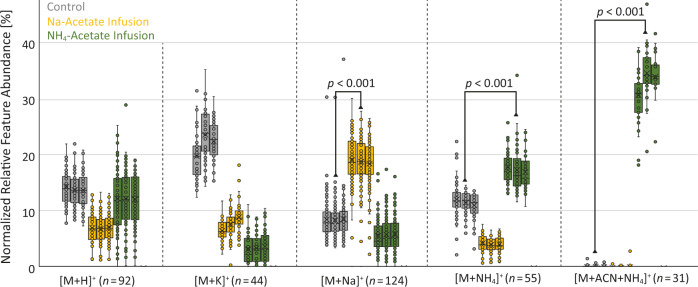
Fig. 3. Statistical impact of salt addition experiments on ion identity abundances.
The relative intensities of selected ion identities are plotted for each post-column infusion in triplicate. The significant change for [M + Na]+ and [M + NH4]+ ion identities in the corresponding post-column salt infusions compared to the control samples agree with the expected ionization behavior. The exclusive formation of an uncommon [M + ACN + NH4]+ in-source cluster in the ammonium acetate buffer infusion further verifies ion identity networking results. Boxplots visualize the median as a horizontal line, the mean as an x, the first (Q1) and third quartile (Q3) as the lower and upper hinges, and the whiskers corresponding to the minimum value below Q1 and the maximum value above Q3 within the 1.5 × IQR (where IQR is the interquartile range). The p-values of a Welch two-samples t-test and the corresponding number of ion identities n are provided for each pair of compared triplicate injections with different post-column salt infusion conditions. Source data are provided as a Source Data file.

