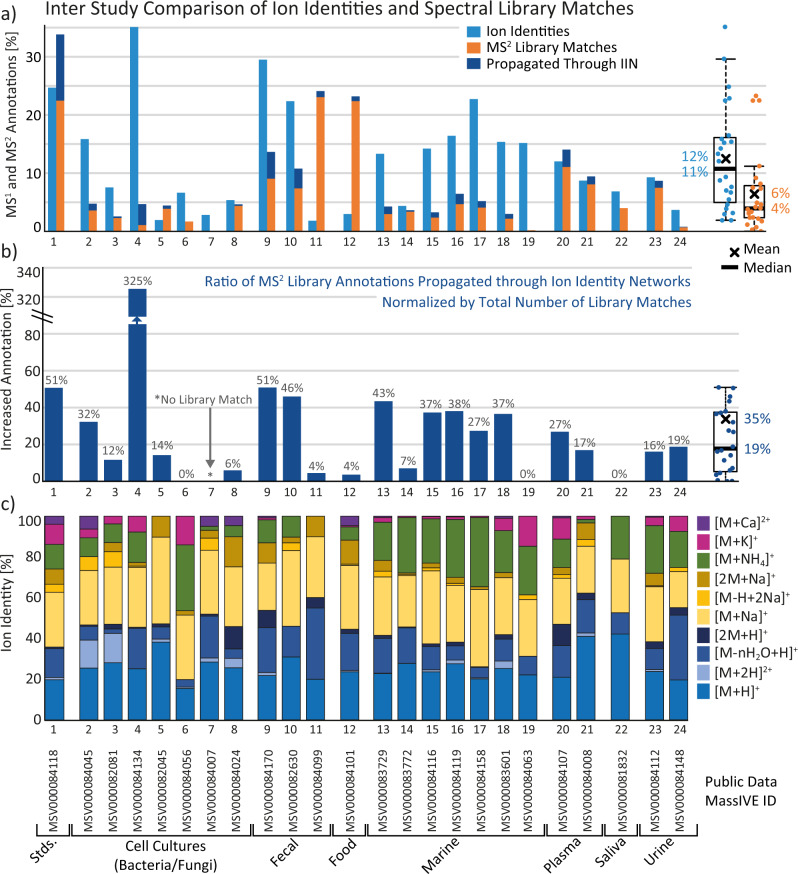
Fig. 4. Overview of IIMN results for 24 experimental datasets.
a Summarizes the relative number of LC-MS features (with an MS2 spectrum) that were annotated by ion identities or matches to the GNPS spectral libraries. The increased annotation rate by propagating library matches to connected unannotated ion identities is highlighted and b displayed as relative gains with a mean increase by 35% compared to all library matches. c Comparison of relative ion formation tendencies measured as the number of ion identities. Boxplots summarize the statistics of overall n = 24 datasets by visualizing the median as a horizontal line, the mean as an x, the first and third quartile as the lower and upper hinges, and the whiskers corresponding to the minimum value below Q1 and the maximum value above Q3 within the 1.5 × IQR. Source data are provided as a Source Data file.

