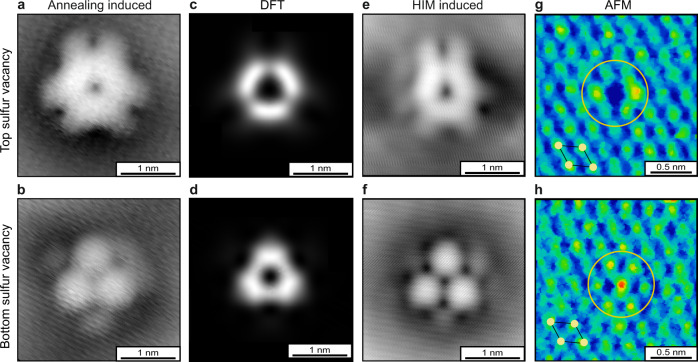
Fig. 3. Scanning probe microscopy of sulfur vacancies in single-layer MoS2 on graphene.
a, b Scanning tunneling microscope (STM) images of annealing induced vacancies in the top and bottom sulfur layer. The STM imaging parameters were tip bias Vbias = 450 mV, tunneling current It = 100 pA. c, d Density functional theory (DFT) calculations of 7 × 7 supercell containing one sulfur vacancy. The image displays a constant height slice 4.5 Å above and below the MoS2 layer corresponding to the charge density from sulfur vacancies in the top and bottom sulfur layer, respectively. e, f STM images of He-ion (HIM) induced top and bottom sulfur vacancies. g, h Atomic force microscopy (AFM) images of the top and bottom sulfur vacancies. The centers of the circles highlight the position of the vacancy defect. The pictogram indicates the sulfur lattice (yellow dots).

