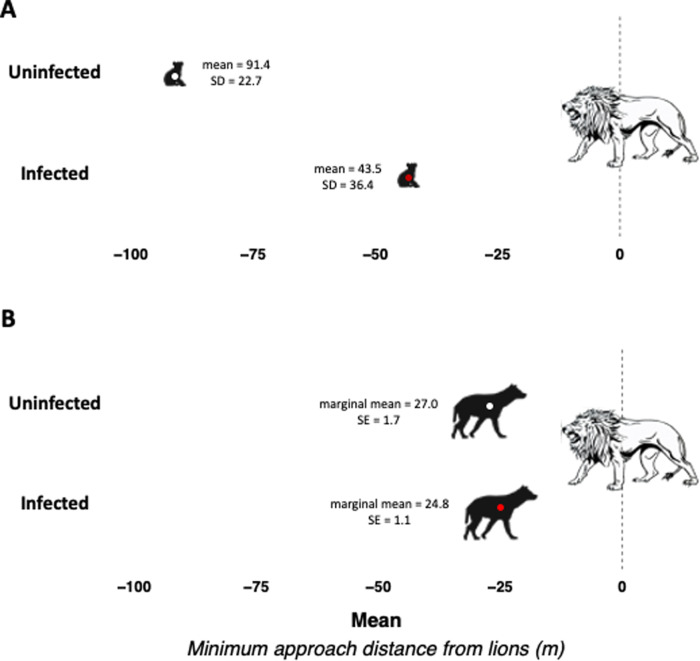
Fig. 1. Mean minimum approach distance to lions for uninfected (white dots) vs. infected (red dots) hyenas.
A Among cubs (N = 15), estimates are raw means and standard deviations based on average minimum approach distance for the uninfected and infected. The cub data set includes only hyenas for which both diagnosis and distance from lions were measured as cubs. B Among subadults/adults (N = 109), estimates are marginal means and standard errors from a mixed-effects linear regression model that included T. gondii infection status as an explanatory variable, distance as a continuous outcome and a random intercept for hyena ID. Source data are provided as a Source Data file.

