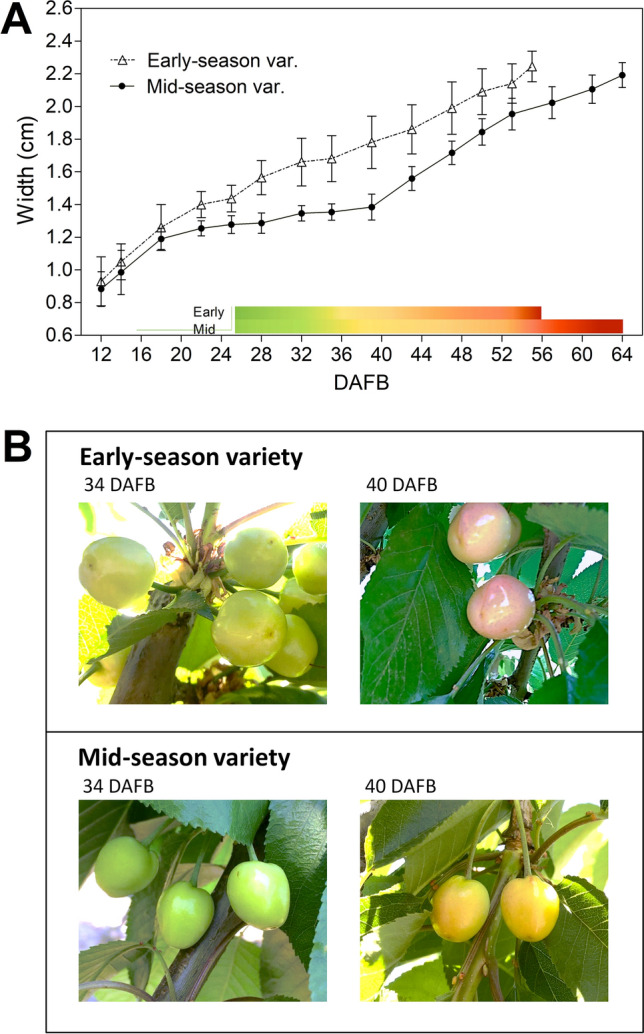
Figure 1.

Changes in fruit size and pink color initiation in early- and mid-season varieties in the 2017–2018 season. (A) Fruit size as the equatorial diameter of the fruits at different days after full bloom (DAFB). Bars represent the mean of three independent biological replicates ± SD. A representation of fruit color changes is included based on the phenology of the 2017 season (Tables S1 and S2). (B) Representative pictures of both varieties at 34 and 40 DAFB. Graphs were performed on GraphPad Prism version 6.04 for Windows, GraphPad Software, www.graphpad.com.
