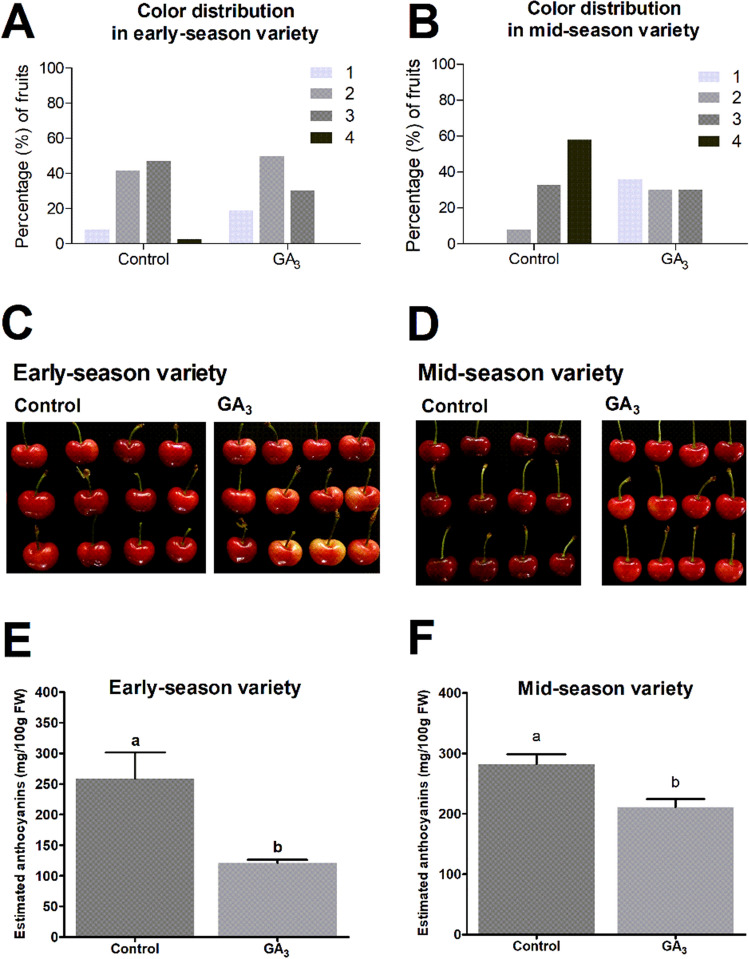
Figure 2.
Effect of GA3 treatment on fruit color and estimated anthocyanin content at ripeness in early- and mid-season varieties (55 and 64 DAFB, respectively) in the 2017–2018 season. GA3 was applied as the commercial product ProGibb 40% SG to individual branches at a rate of 30 ppm. GA3 treatment was at the light green-to-straw yellow transition of the fruits at 35 DAFB in both varieties (November 2, 2017). (A,B) Color distribution according to CTIFL color chart (1 is the lightest and 4 is darkest fruit color detected). The percentage (%) is calculated considering the number of fruits having a given category over the total number of fruits. (C,D) Representative picture of control- and GA3-treated fruits. (E,F) Endogenous estimated anthocyanins in the fruits on a fresh weight (FW) basis, based on cyanidin-3-O-rutinoside content, representing more than 98% of the total anthocyanins in each of the samples. Bars represent the mean of three independent biological replicates ± SEM. The significance of variation between control- and GA3-treated fruits was tested by one-way ANOVA analysis with Tukey's post hoc test, whereby different letters are significantly different means (p < 0.05). Graphs were performed on GraphPad Prism version 6.04 for Windows, GraphPad Software, www.graphpad.com.

