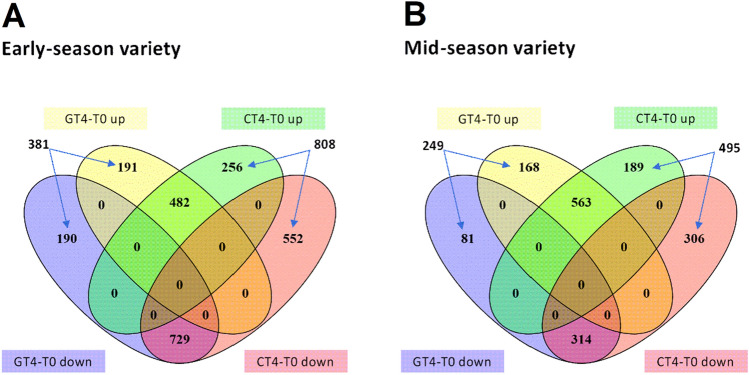
Figure 4.
GA3-mediated changes in gene expression in early- and mid-season varieties in the 2017–2018 season. (A,B) Venn diagrams showing the number of differentially expressed genes (DEGs), up or downregulated, identified in the pairwise comparisons GT4-T0 and CT4-T0 of each variety, where T0 are samples collected minutes before the GA3 treatment and T4 are samples collected four days after the GA3 treatment (GT4 samples) or the control treatment (CT4 samples). DEGs were defined as having an absolute fold change value of at least two and a false discovery rate (FDR) less than < 0.05. Venn diagrams were constructed using the online tool VENNY version 2.1, http://bioinfogp.cnb.csic.es/tools/venny/index.html.

