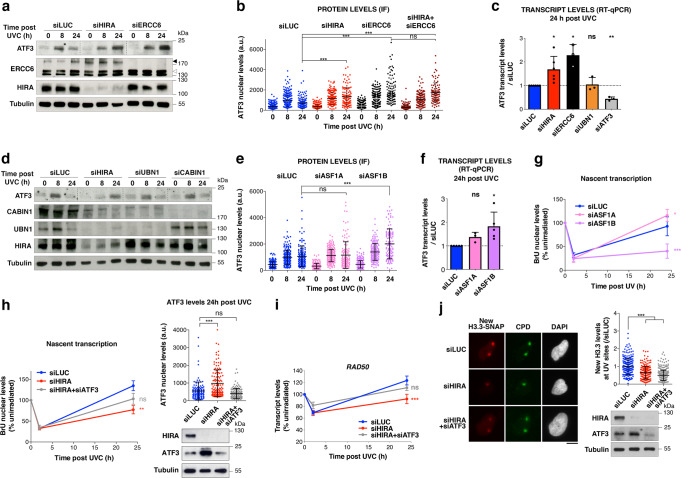
Fig. 6. HIRA promotes transcription recovery after UVC damage through ATF3 downregulation.
a, d Western blot analysis of ATF3 protein levels at the indicated time points post UVC irradiation in HeLa cells treated with the indicated siRNAs (siLUC, control; black arrowhead, ERCC6 full-length; white arrowhead, ERCC6 splice variant; Tubulin, loading control). Dotted lines on the ATF3 panels delineate different siRNA conditions on the same exposure. b, e ATF3 nuclear levels analysed by immunofluorescence (IF) at the indicated time points post UVC irradiation in HeLa cells treated with the indicated siRNAs (siLUC, control). Knockdown efficiencies are controlled by western blot (Tubulin, loading control; for panel b, refer to Supplementary Fig. 5d). The scatter plots show ATF3 levels in cell nuclei (mean ± s.d. from at least 94 cells). Similar results were obtained in two (b) and three (e) independent experiments. a.u. arbitrary units. c, f ATF3 transcript levels (normalised to GAPDH) analysed by RT-qPCR 24 h post UVC in HeLa cells treated with the indicated siRNAs (siLUC, control). Results are presented relative to siLUC (mean ± s.d. from at least three independent experiments). g, h Nascent transcript levels analysed by bromo-uridine (BrU) incorporation in UVC-irradiated HeLa cells treated with the indicated siRNAs (siLUC, control). The line graphs represent mean values ± s.e.m. from three (g) and six (h) independent experiments, scoring at least 79 cells per experiment. siRNA efficiencies are controlled by western blot (Tubulin, loading control) and by ATF3 immunofluorescence 24 h post UVC irradiation as shown on the scatter plot (mean ± s.d. from at least 117 cells; similar results were obtained in three independent experiments). i Transcript levels analysed by qRT-PCR for the RAD50 gene product in HeLa cells treated with the indicated siRNA (siLUC, control). Mean ± s.e.m from five independent experiments. j New H3.3 accumulation at UVC damage sites (marked by CPD immunostaining) analysed 2 h post local UVC irradiation in U2OS H3.3-SNAP cells treated with the indicated siRNAs (siLUC, control). Knockdown efficiencies are controlled by western blot (Tubulin, loading control). New H3.3 levels at UV sites are shown on the scatter plot (mean ± s.d. from at least 193 cells scored in three independent experiments). a.u. arbitrary units. Statistical significance is calculated by one-way (b, c, e, f, h, j scatter plots and bar graphs) and two-way ANOVA (g, h, i line graphs) with Bonferroni posttest *: p < 0.05; **: p < 0.01; ***: p < 0.001; ns: p > 0.05. Scale bars, 10 μm. Source data are provided as a Source Data file.

