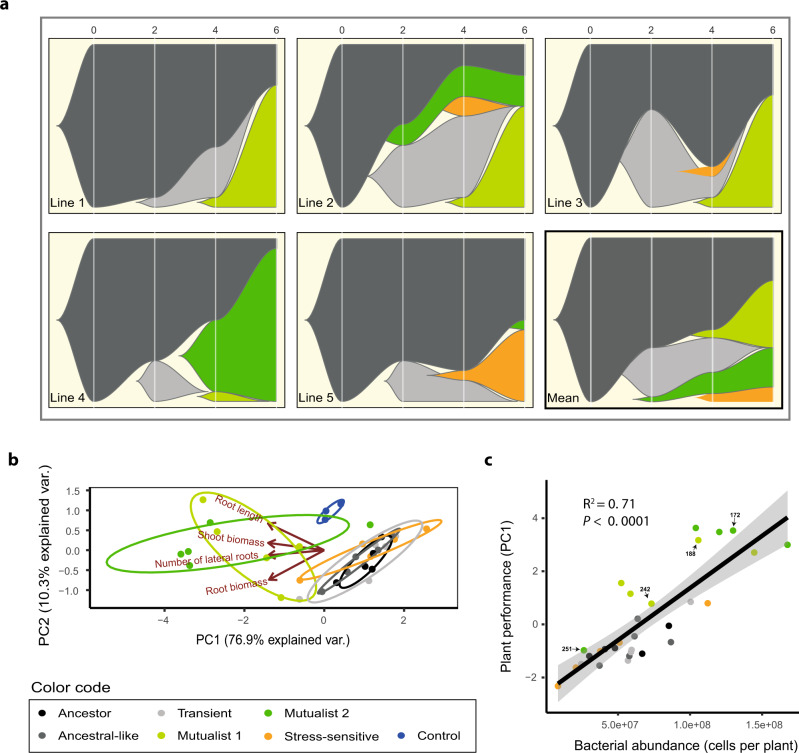
Fig. 2. Temporal changes in bacterial phenotypes during the selection experiment and positive correlation between evolved bacteria and plant growth.
Panels in a show the dynamics of five bacterial phenotype groups across five plant replicate lines and the overall mean pattern during six growth cycles (6 months). The x-axis shows the plant growth cycle (0: ancestral bacterium) and the y-axis shows the relative abundance of each bacterial phenotype. Panel b shows a principal component analysis (PCA) for five representative bacterial isolates from each evolved phenotype group in addition to ancestor isolates (see Table S2) based on their plant growth-related traits. The negative PC1 values of each isolate were extracted and combined to a ‘Plant performance’ index, which included bacterial effects on shoot biomass, root biomass and root architecture explaining 76.9% of the total variation in plant growth. Panel c shows a positive correlation between ‘Plant performance’ and bacterial abundance on the plant roots at the end of the fitness assays; the black line and grey area indicate the linear regressions with 95% confidence intervals, respectively (n = 30, biologically independent isolates, see Table S2; P = 4.296e−09). In all panels, bacterial phenotype groups are displayed on different colours (black: ancestor; dark grey: ancestral-like; light grey: transient; orange: stress-sensitive, light green: mutualist 1 and dark green: mutualist 2). The sample IDs of four isolates from the two mutualistic phenotype groups are highlighted on labels. Data for all panels are provided in the Source Data file.

