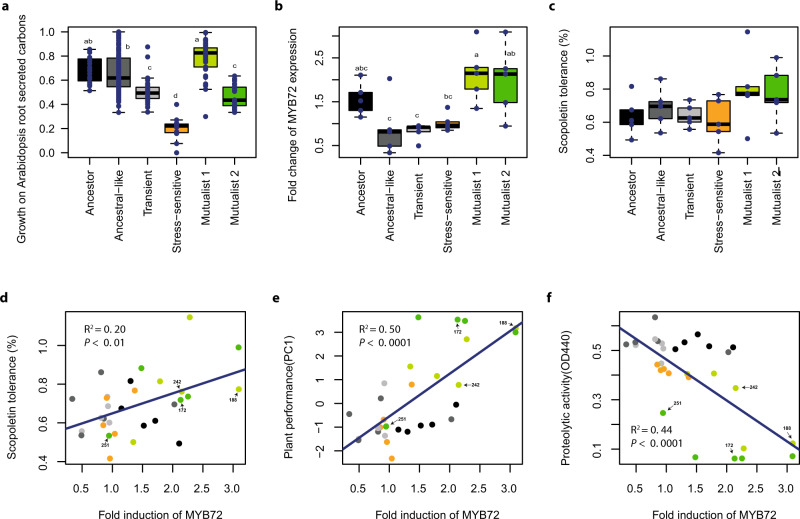
Fig. 3. Selection mechanisms favouring the increase in the relative abundance of mutualists in the rhizosphere of Arabidopsis thaliana.
Panel a shows the growth of ancestor and evolved Pseudomonas protegens CHA0 phenotypes on carbons typically secreted by A. thaliana (14 most dominant carbons analysed as a combined index based on normalised first principal component PC1, which explained 83.9% of total variation). In total, 256 isolates were characterized including ancestral (n = 16), ‘Ancestral-like’ (n = 119), ‘Transient’ (n = 41), ‘Stress-sensitive’ (n = 11), ‘Mutualist 1’ (37), and ‘Mutualist 2’ (n = 31) phenotypes. Panel b shows the effect of ancestor and evolved P. protegens CHA0 phenotypes on the expression of MYB72 (transcription factor responsible for scopoletin production) in the roots of a GUS A. thaliana reporter line (based on the quantification of GUS staining of the roots, Fig. S6). Panel c shows the relative growth of ancestor and evolved P. protegens CHA0 phenotypes in the presence of the plant-secreted scopoletin antimicrobial at 2 mM concentration after 72 h of incubation relative to no-scopoletin control. Panel d shows a positive relationship between MYB72 expression (fold induction; x-axis) and scopoletin tolerance (y-axis) for all tested isolates. Panel e shows a positive relationship between MYB72 expression (fold induction; x-axis) and plant performance (y-axis) for all tested isolates. Panel f shows a negative relationship between MYB72 expression (fold induction; x-axis) and proteolytic activity (y-axis) for all tested isolates. The sample IDs of four isolates from the two mutualistic phenotype groups are highlighted on labels (see Table S2) in panels d–f. Panels b–f include five representative bacterial isolates (n = 5, biologically independent isolates) from each phenotype in addition to the ancestor (each replicate line represented; see Table S2). In all panels, bacterial phenotype groups are displayed on different colours (black: ancestor; dark grey: ancestral-like; light grey: transient; orange: stress-sensitive, light green: Mutualist 1 and dark green: Mutualist 2). All boxplots show median (centre line), interquartile range (25–75%) and whiskers that extended 1.5 times the interquartile range overlaid with a scatter plot showing independent replicates. Statistical testing in panels a–c was carried out using one-way ANOVA followed by Tukey’s multiple comparison test (α = 0.05; different lowercase letters indicate significant differences). Panels d–f show linear regression (black line) and Pearson correlations fitted over all biologically independent isolates (n = 30). Data for all panels are provided in the Source Data file.

